Currently, I’m enrolled in STAT 545A: Exploratory Data Analysis, where students are introduced to data wrangling, exploration, and analysis with R.
The data: 60 students
The instructor (Jenny Bryan) recently compiled and made public (as a means to encourage and inspire our own data exploration) some enrollment details of students to this course.
I, for one, was interested. I wanted to see what the data looks like and what stories it might reveal about my peers and I. Pictorially, the raw data looks like the following:
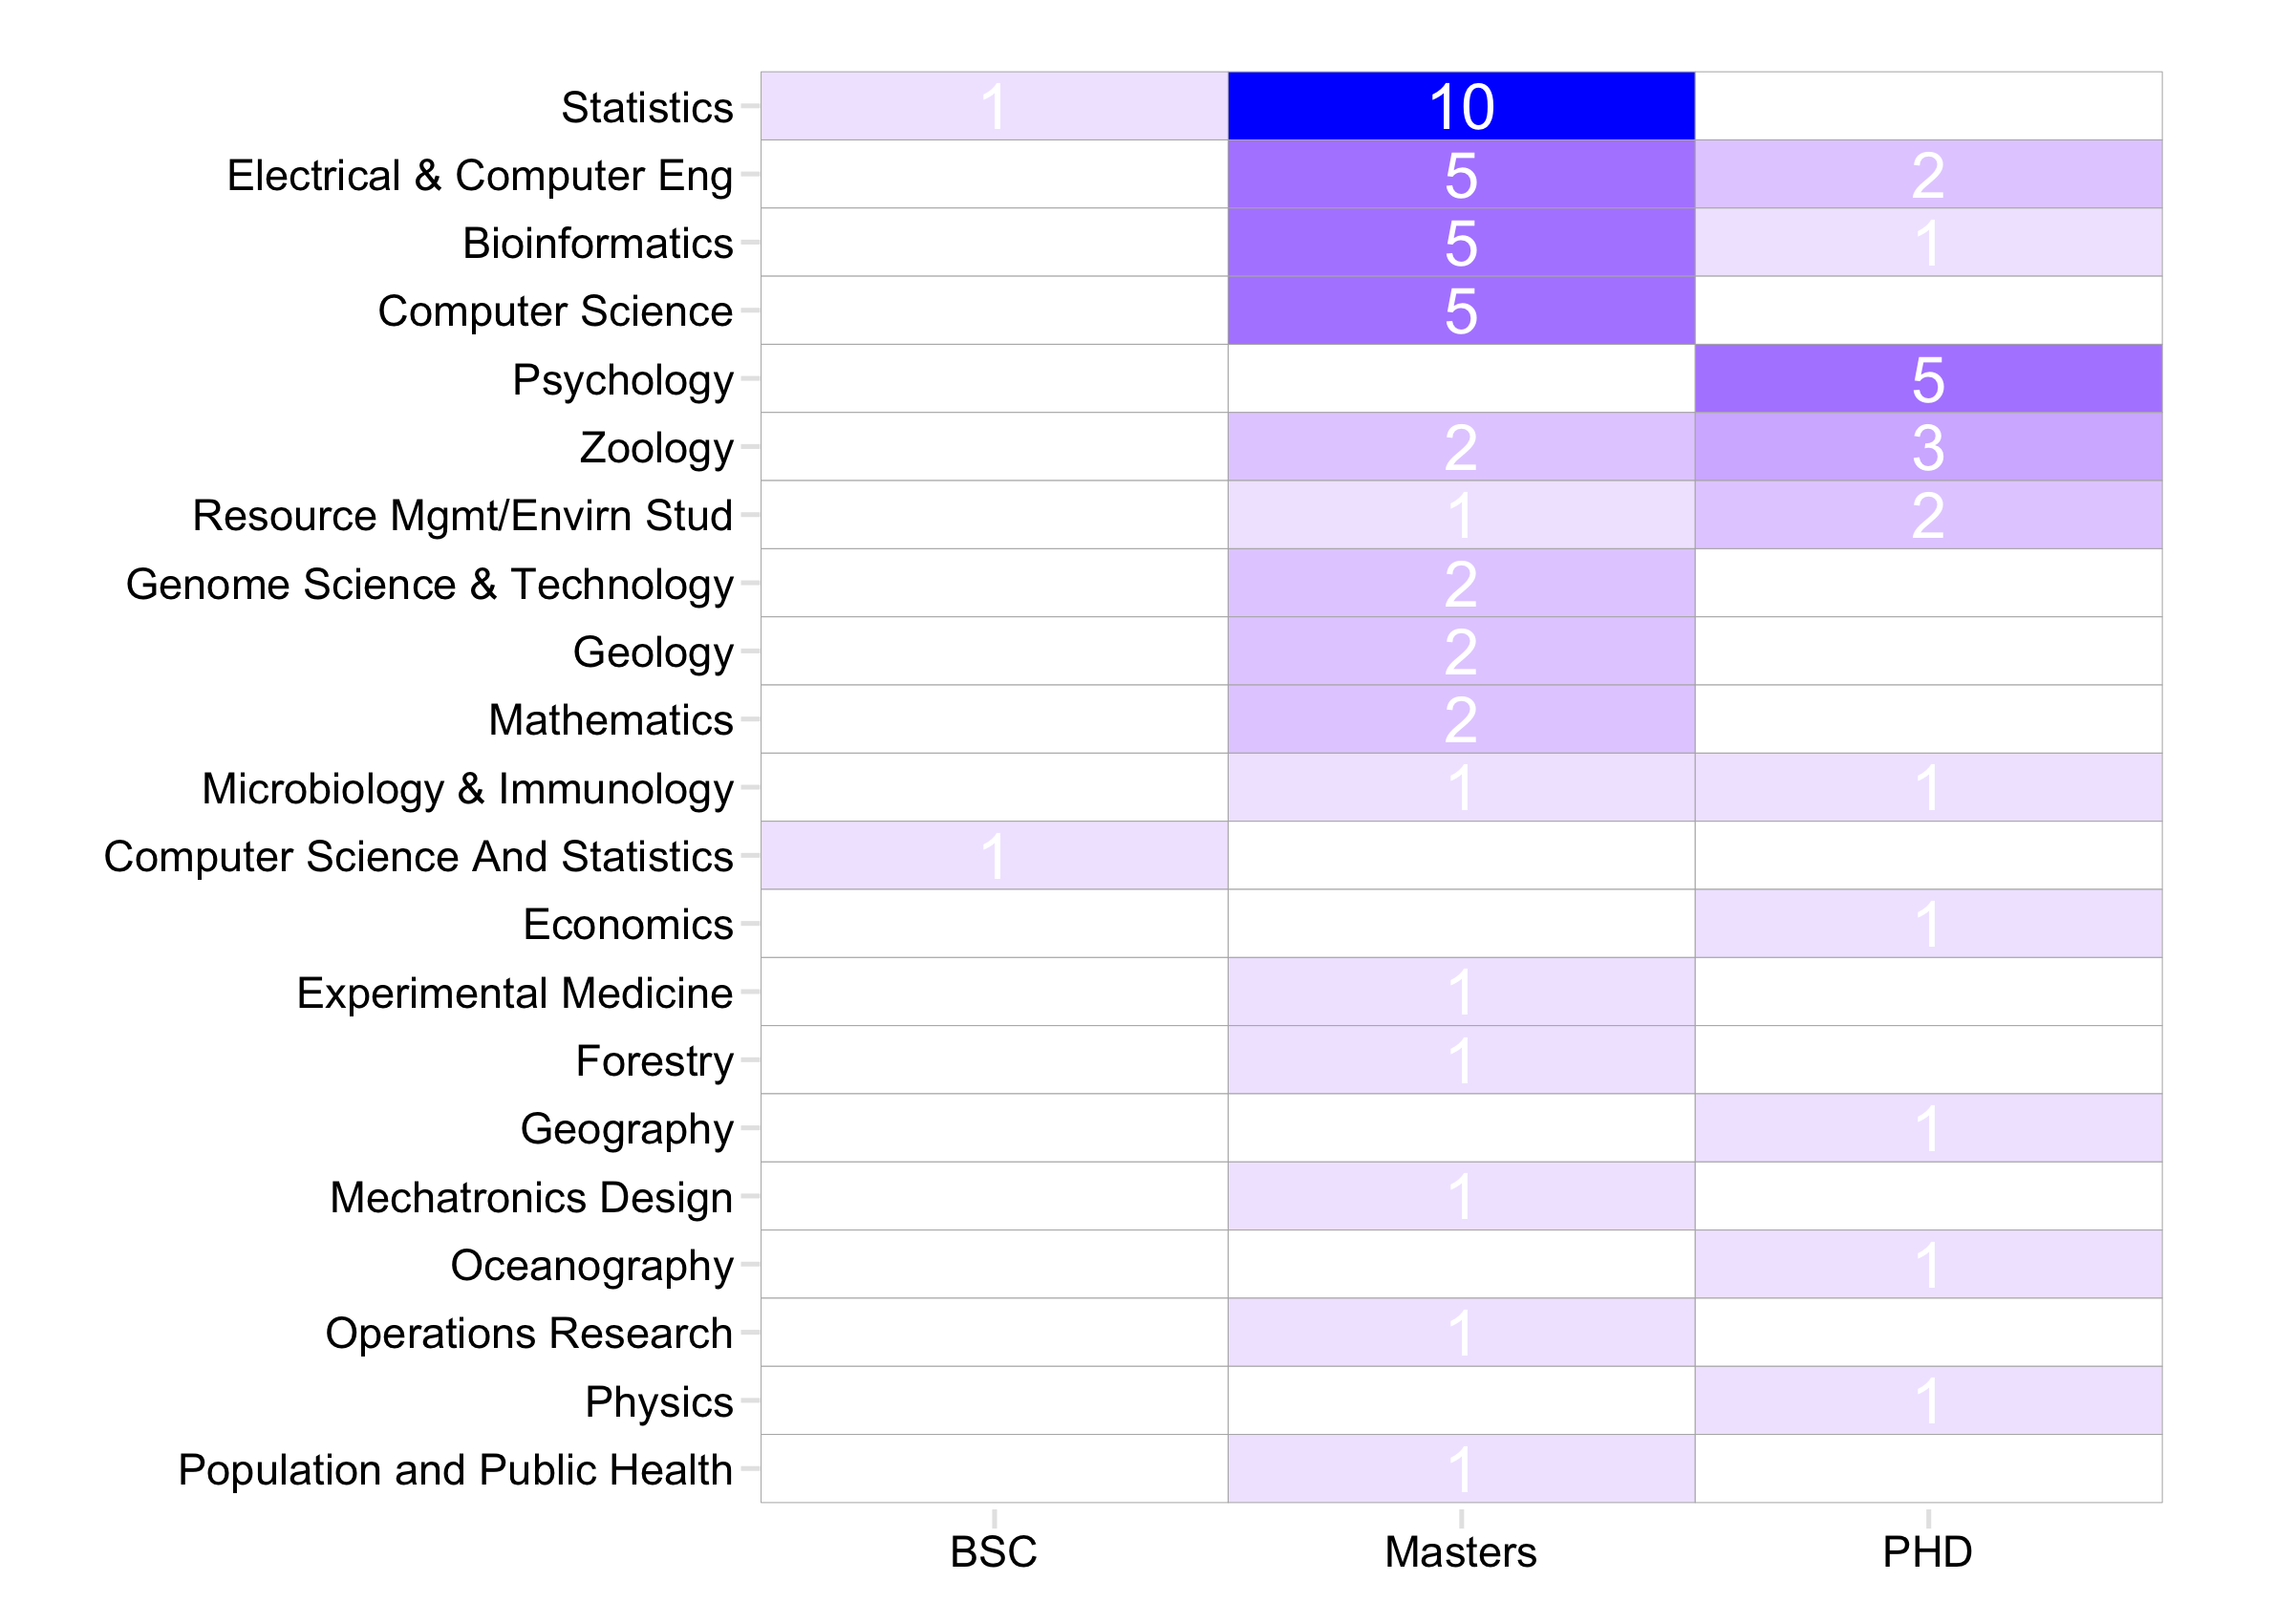
This heatmap, ordered by the total number of students per program, represents the 60 students enrolled to STAT 545A this year. It shows that most students taking this course belong to Statistics (18.3%), which is unsurprising since the course (i.e. STAT 545A) is provided by the Department of Statistics. As a Bioinformatics student, we are representing third place (10.0%).
Mostly Masters plus 2 BSc students
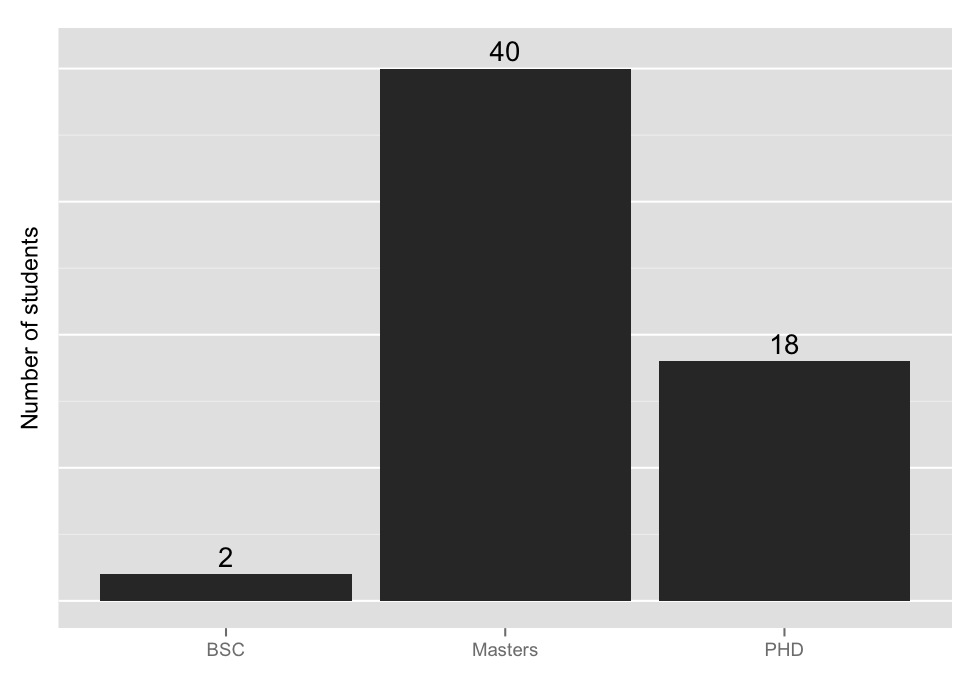
Looking at the data differently, we see that there is twice as many Masters students (me) than PHD students (not me). We can also see there are 2 BSC students enrolled in this graduate course.
PhDs from Geography and Oceanography
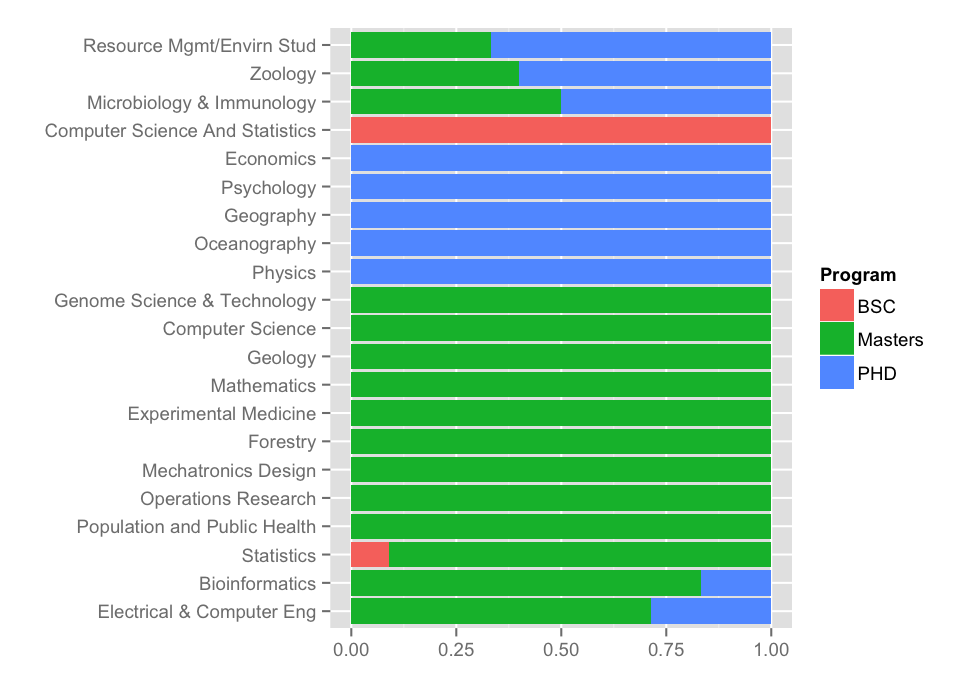
Normalizing the data across subjects, we see that from Economics, Psychology, Geography, Oceanography, and Physics only PhD students are enrolled.
Diversity of students
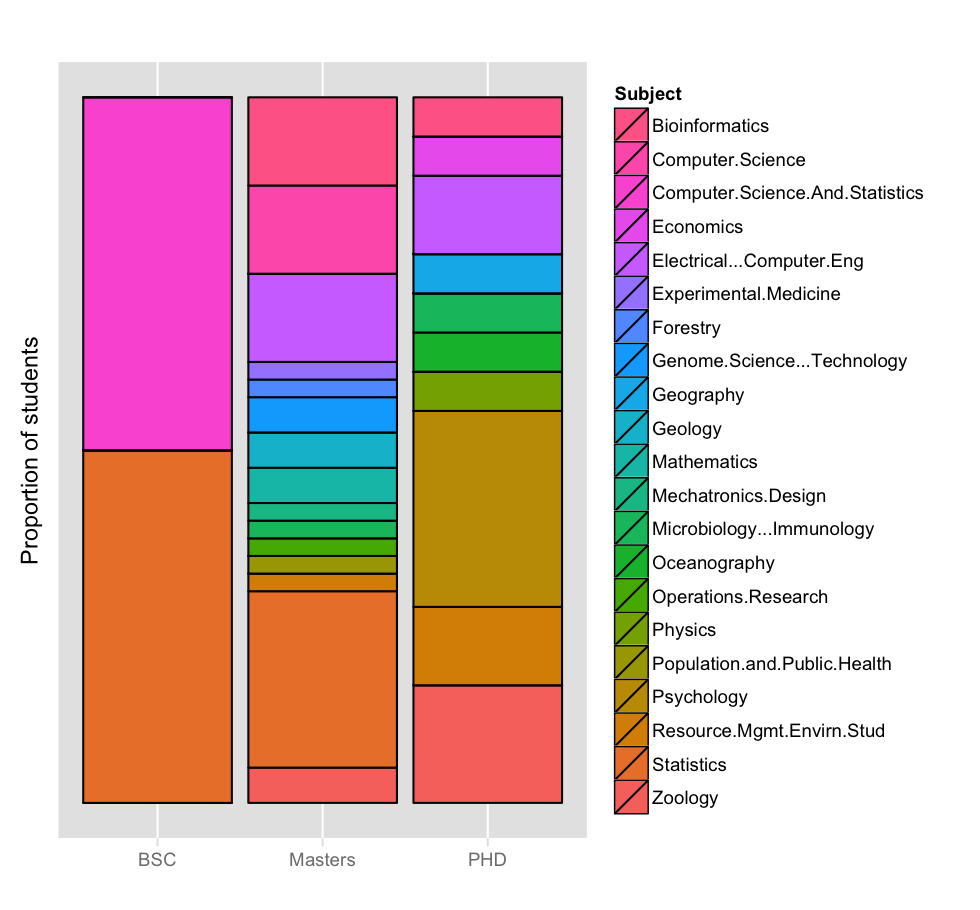
Data science is multidisciplinary and this is exemplified by the diverse enrollment of students to STAT 545A during this year.