Halloween was yesterday. And this means that kids will be sorting their candies into piles of joy and despair. One such ranking is the 2015 Candy Hierarchy, where any full-sized candy bar brings the most joy and a broken glow stick brings the most despair.
On the other hand, I – someone who did not go trick-or-treating – will be looking at the bad teeth per child (12 yr) in 2004 dataset from gapminder.org. Note: there was no other more recent bad teeth data besides those of 2004 and as such this was the data to be analyzed in this post. Additionally, in the process of tidying this data, I also added columns for regional information from lukes’ SO-3166-Countries-with-Regional-Codes ; the tidied dataset can be found at:
Top and bottom 5 countries for bad teeth
In this dataset there are 190 countries with the number of bad teeth ranging from 6.3 to 0.2. The top and bottom 5 countries with the highest and lowest average number of bad teeth per child is given in the following table:
| country | rank | badTeeth | |
|---|---|---|---|
| 1 | Martinique | 1 | 6.3 |
| 2 | Saint Lucia | 2 | 6 |
| 3 | Saudi Arabia | 3 | 5.9 |
| 4 | Saint Kitts and Nevis | 4 | 5.5 |
| 5 | Serbia and Montenegro | 5 | 5.35 |
| … | … | … | … |
| 186 | Liberia | 67 | 0.4 |
| 187 | Rwanda | 68 | 0.3 |
| 188 | Tanzania | 68 | 0.3 |
| 189 | Togo | 68 | 0.3 |
| 190 | Bermuda | 69 | 0.2 |
Bad teeth per child around the world

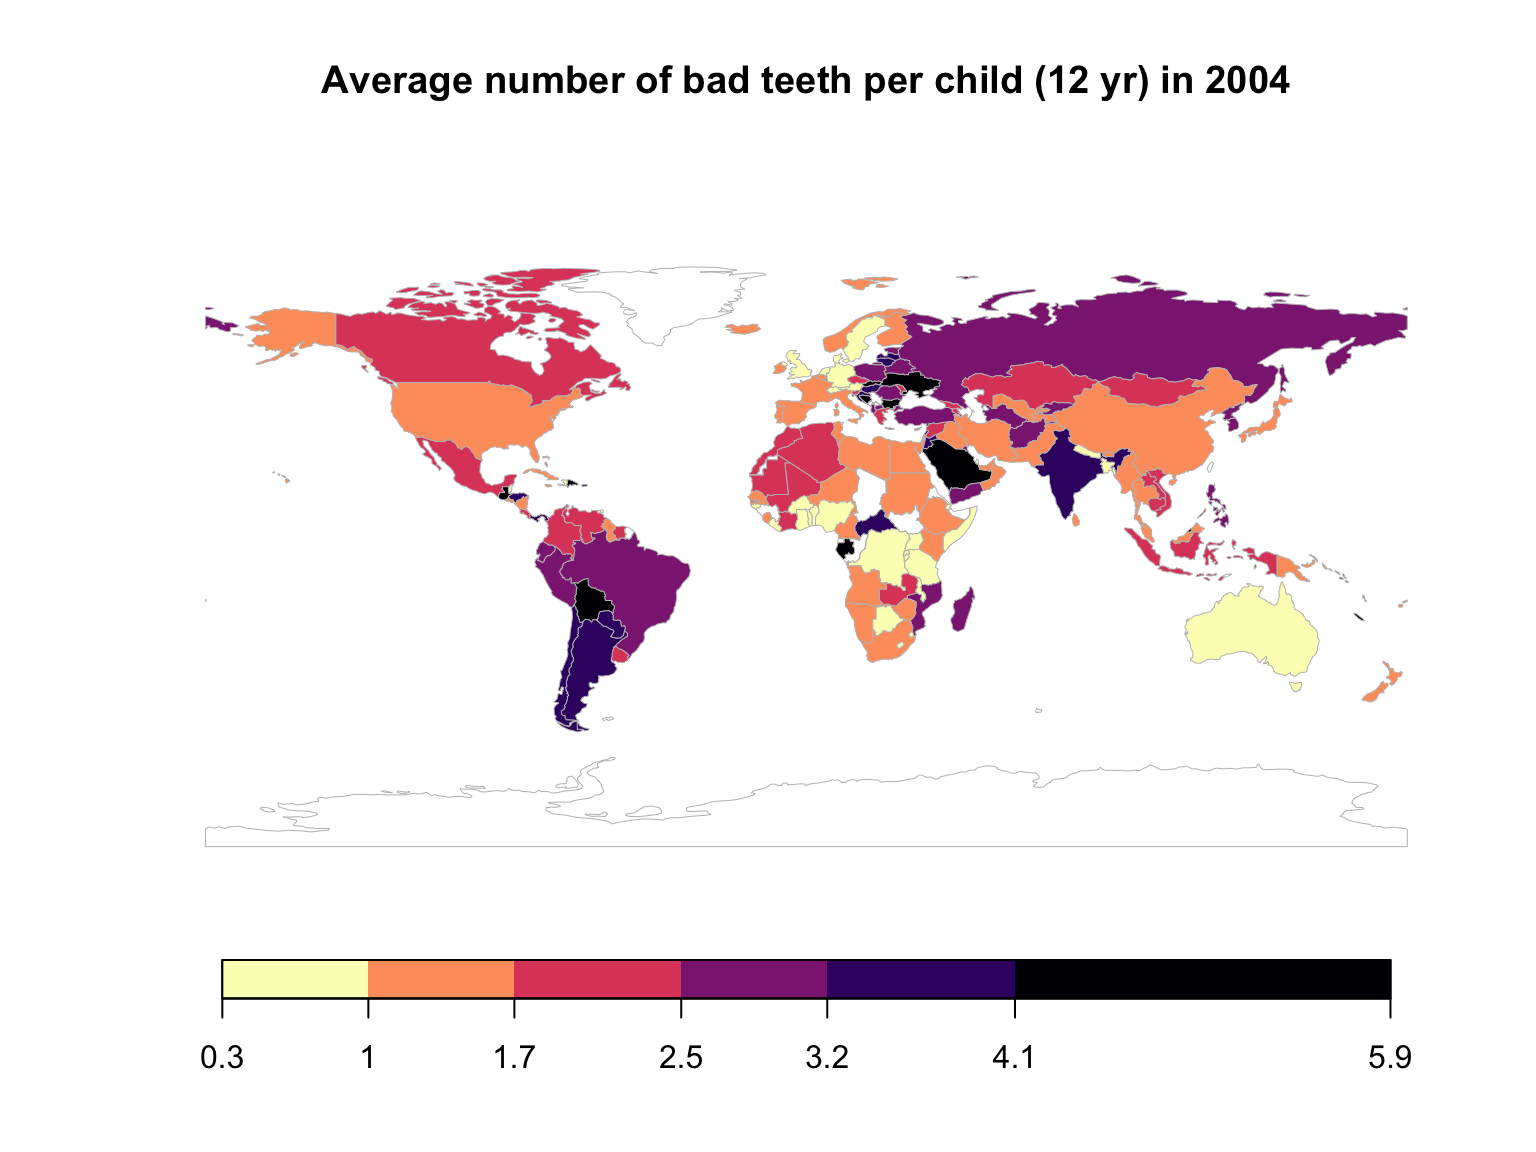
When we plot the bad teeth count on a map, we see that there are more bad teeth in South America than North America, more bad teeth in Canada than the US, and the presence of different localized bad teeth ranges across Africa.
Bad teeth by continent

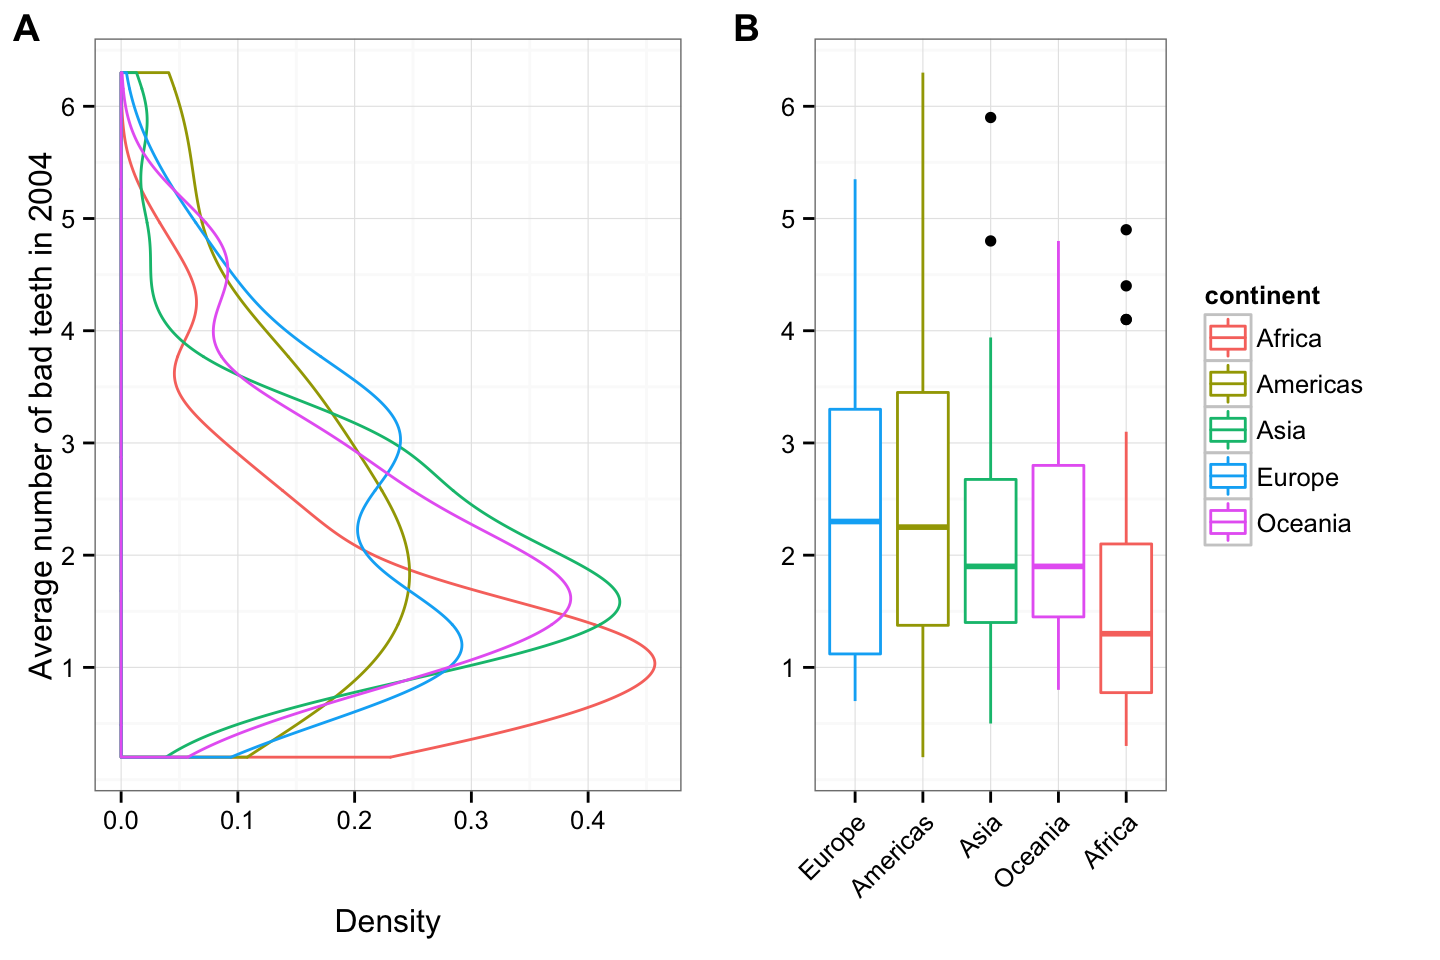
When we group the average number of bad teeth per 12 year old child per country by continent and sort by the median value (Fig. B), we see the worst teeth are in Europe and the Americas, okay teeth are in Asia or Oceania, and the best teeth are in Africa.
Bad teeth by subregion

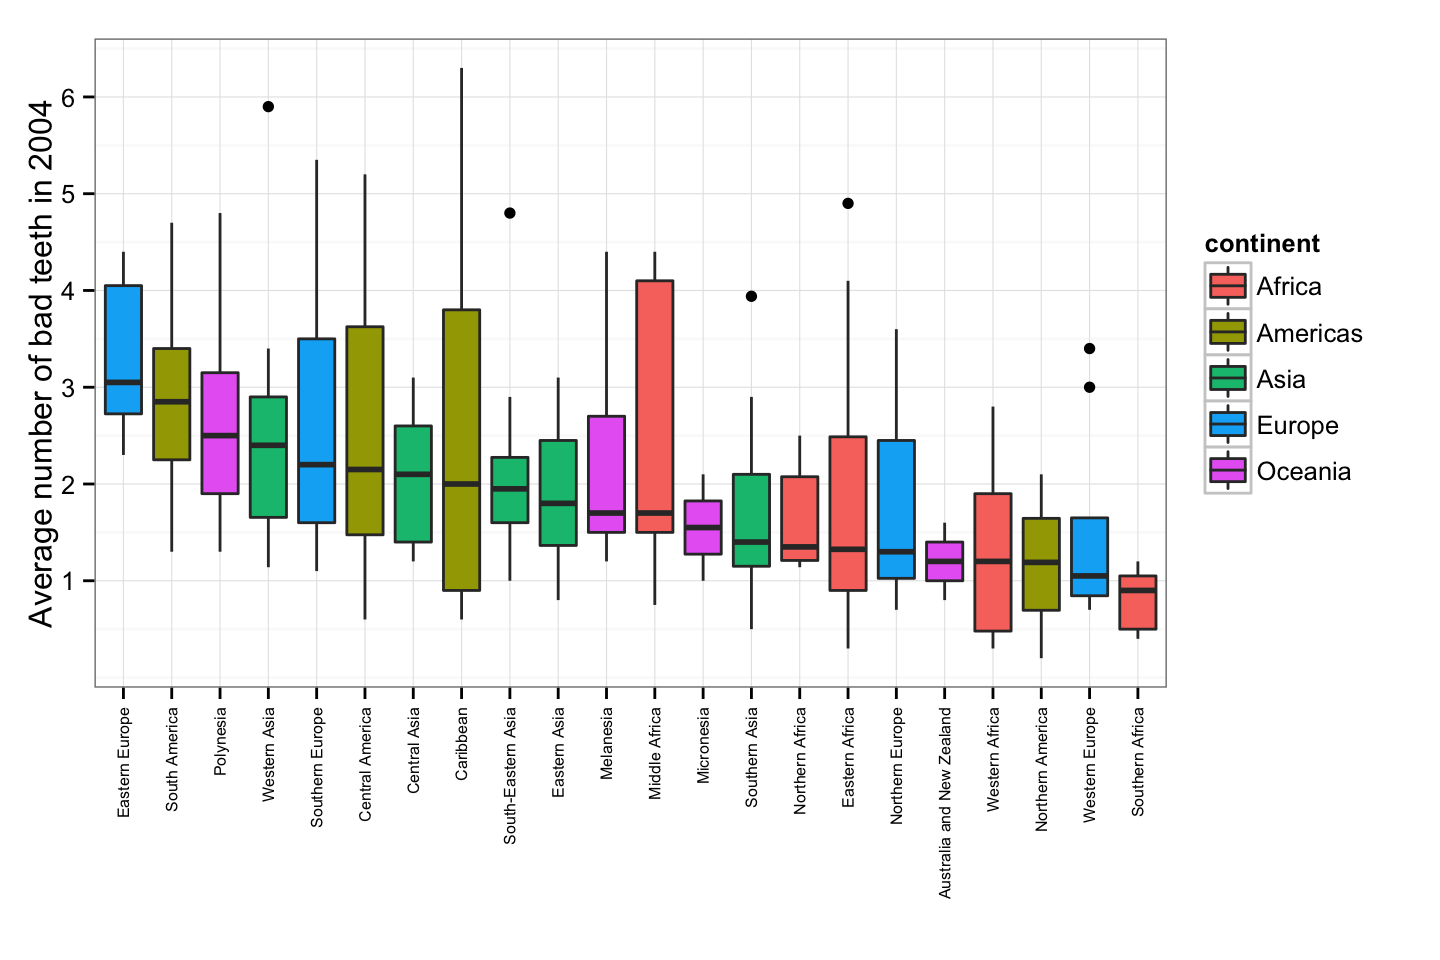
If instead we group the average number of bad teeth per 12 year old child per country by subregion and sort by the median value, we see a different story e.g. bad teeth in Europe greatly differs between Western Europe (e.g. have more good teeth) and Eastern Europe (e.g. have more bad teeth); Northern America has more good teeth than South America; and the teeth quality of Asian subregions are pretty consistent.
| continent | median | medianRank | medianSubregion | medianSubregionRank |
|---|---|---|---|---|
| Americas | 2.25 | 2 | 2.075 | 1 |
| Asia | 1.90 | 3 | 1.950 | 2 |
| Europe | 2.30 | 1 | 1.750 | 3 |
| Oceania | 1.90 | 3 | 1.625 | 4 |
| Africa | 1.30 | 5 | 1.325 | 5 |
When we consider the teeth quality across continents at the subregional level, the ranks of the calculated median of bad teeth in a continent’s subregions (medianSubregionRank) differs from the calculated median of bad teeth in a continent’s countries (medianRank). Here we see the worst teeth are in the Americas and Asia, okay teeth are in Europe and Oceania, and the best teeth are again in Africa.
Overall, it seems that on average Africa has the best teeth in children of 12 years of age in 2004.