In this post, I would like to share the attendance in STAT 547M dataset that I created as part of my “I wonder how many people are taking this class” thought experiment.
The concoction of this dataset was inspired by @jennybc who made available the dataset for the Enrollment in STAT 545A in 2015 by degree and program.
About STAT 547M
STAT 547M is the second half of the STAT 545A and STAT 547M: Data wrangling, exploration, and analysis with R course taught by @jennybc. Each week, there were 2 classes: one on Tuesday and the other on Thursday. In this 6 week class, we learned about:
- week 1: data input/output & regex
- week 2: data wrangling & tidying of web survey data
- week 3: building your first R package
- week 4: task automation, pipelines, and GNU Make
- week 5: getting data from the web
- week 6: building Shiny apps
Attendance is high in the first weeek
Here we plot the total number of people in attendance (including students + TAs) for each day of the course.
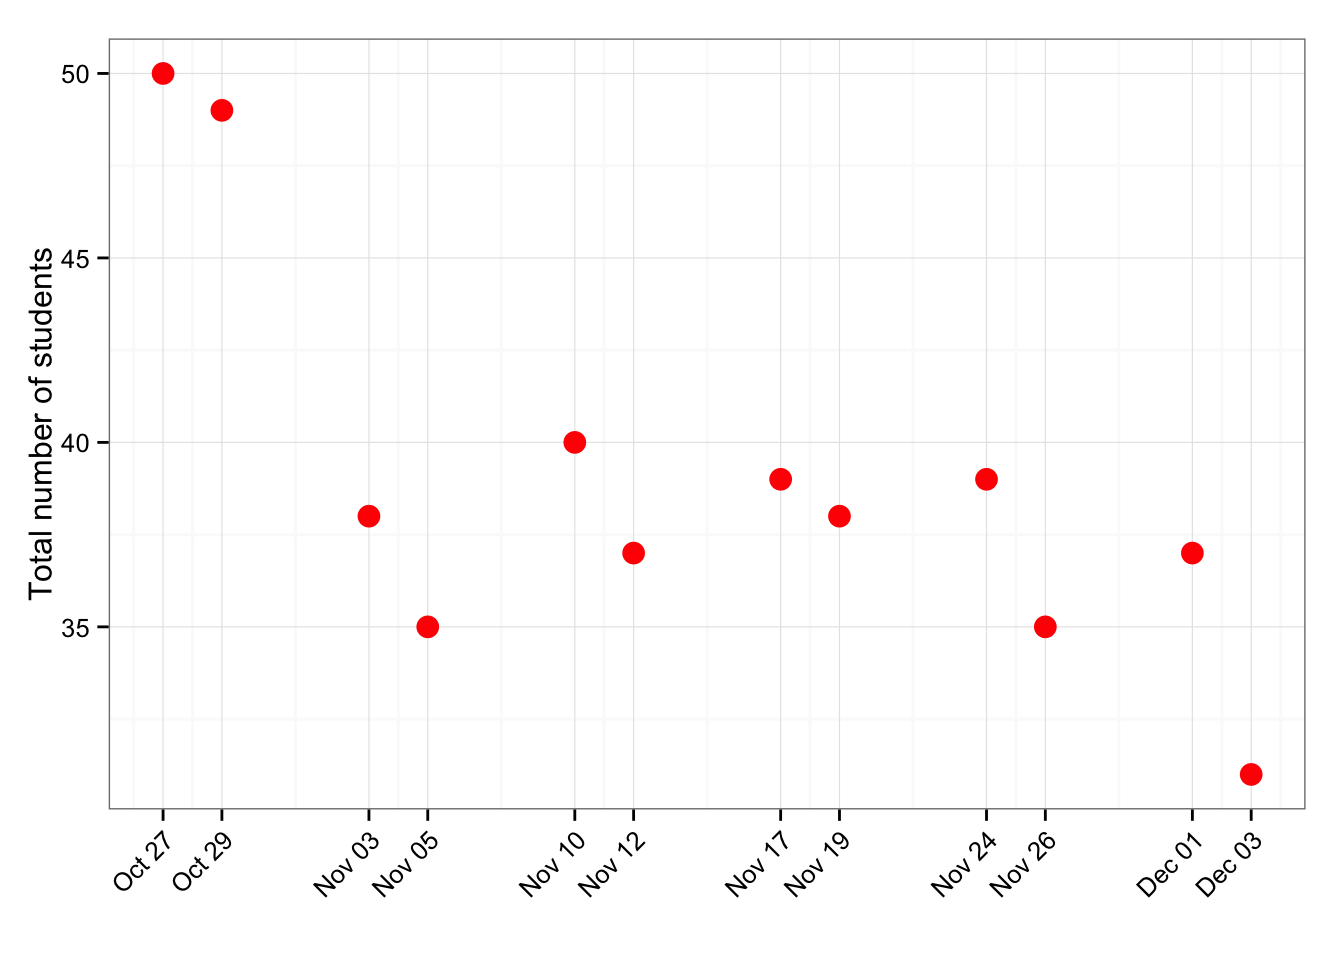
As expected, attendance in the first week is high. We can also see that there is more attendance on Tuesdays (where new material is introduced) than Thursdays (where the Tuesday material is expanded).
Besides the first week, week 3 – building your first R package – was also relatively popular.
It is also interesting to see that there was the fewest number of students in attendance in the last class when we learned about building a Shiny app.
Most people sit on the right side of the room
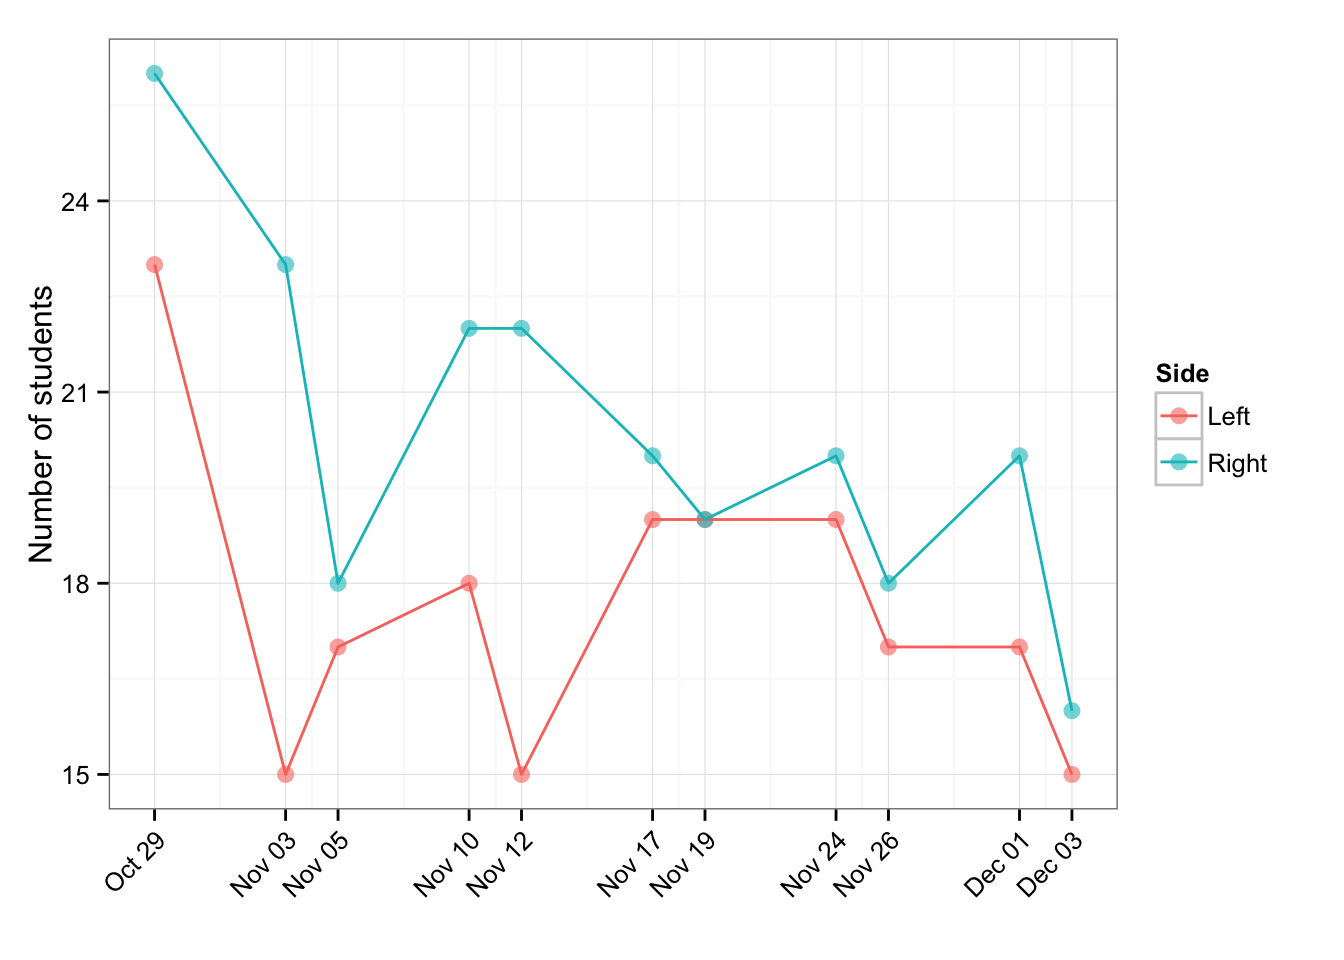
When we plot the number of people sitting on the left vs right side of the room, we see that most people tend to sit on the right (a.k.a. the professor’s left). This phenomena might be because out of the two doors leading to opposite sides of the classroom, the door leading to the right side is closer to the stairway which leads to the classroom i.e. the path of least resistance.
Most people sit in the second and back rows
In the classroom, there are 5 rows. Here we plot the number of students in each row for each day. We also included the average number of students per row per day as denoted by the black dots.
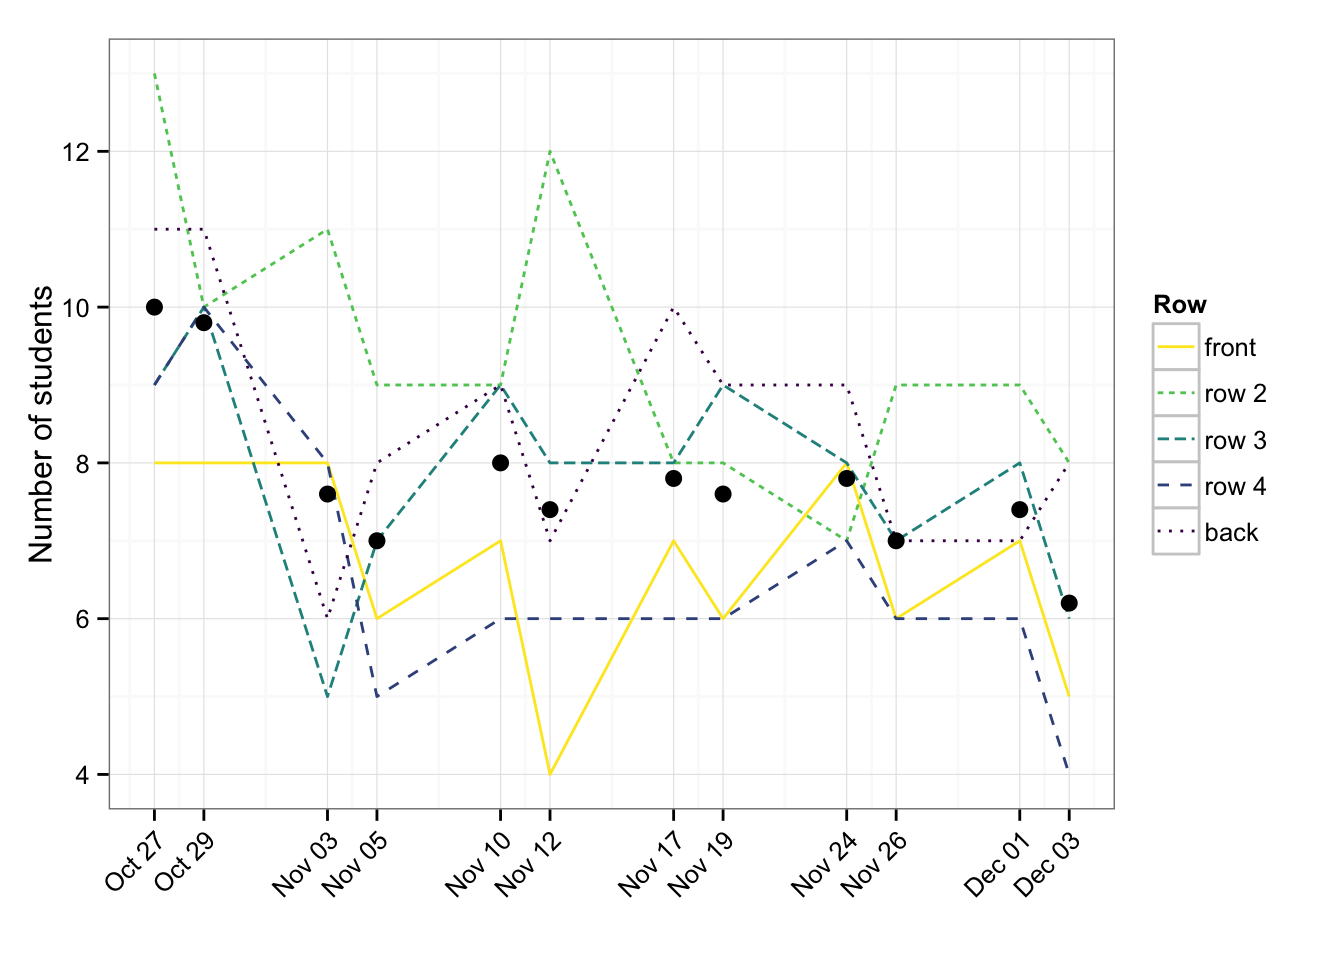
From this graph, we see that:
- students prefer to sit either in the second (light green dashed line) or last (dotted line) row, and
- sitting in either the front (yellow solid line) or fourth (dashed line) row is least desirable.
Rationale/Conspiracy theory:
- If you sit in the front row, you’re probably a keener
- If you sit near the front, you’re probably going to pay close attention to the lesson
- If you sit in the second row, you’re a keener, but you don’t want to be seen as a keener, so you’re going to sit in the second row
- If you sit in the second row, you want to be close to the professor, but being too close is scary, so you need the protection and barrier of the front row
- If you sit in the back row, it’s less likely for others to see what you’re doing on your laptop
- If you sit in the back row, you’re probably not going to pay full attention to the lesson
- If you sit in the back row, you’re a TA (who – now that I think about it – kind of need to be in attendance) and need to spot the students who need help
- If you sit in the back row, you got tired of sitting in the front row during nearly every class in undergrad and so now that you’re a grad student (and realized that there was no point to being a keener) you’re going to sit in the back row