I passed! And so, to do something different, I decided to visualize data in D3. The product of this project is found at bl.ocks.org/csiu.
25 drinks and counting
One of the things that I keep track of is the number of drinks I had. Near the start of my thesis, I remember someone mentioning that it’s hard to find someone (outside personal/cultural/religious reasons) who did not have more than 10 drinks. At that point I was at less than 10, but now I’m at 25.
What happened?
Calendars in D3
After referring to my list of drinks, calendar of events, and trip down memory lane, I compiled a list of dates and drinks. Since this is time series data, I decided to visualize this as one would in a calendar.
Looking online, I based my code on the following examples:
- bl.ocks.org/mbostock/4063318 for the foundation of the code
- bl.ocks.org/eesur/5fbda7f410d31da35e42 for adding in the months of the year and days of the week
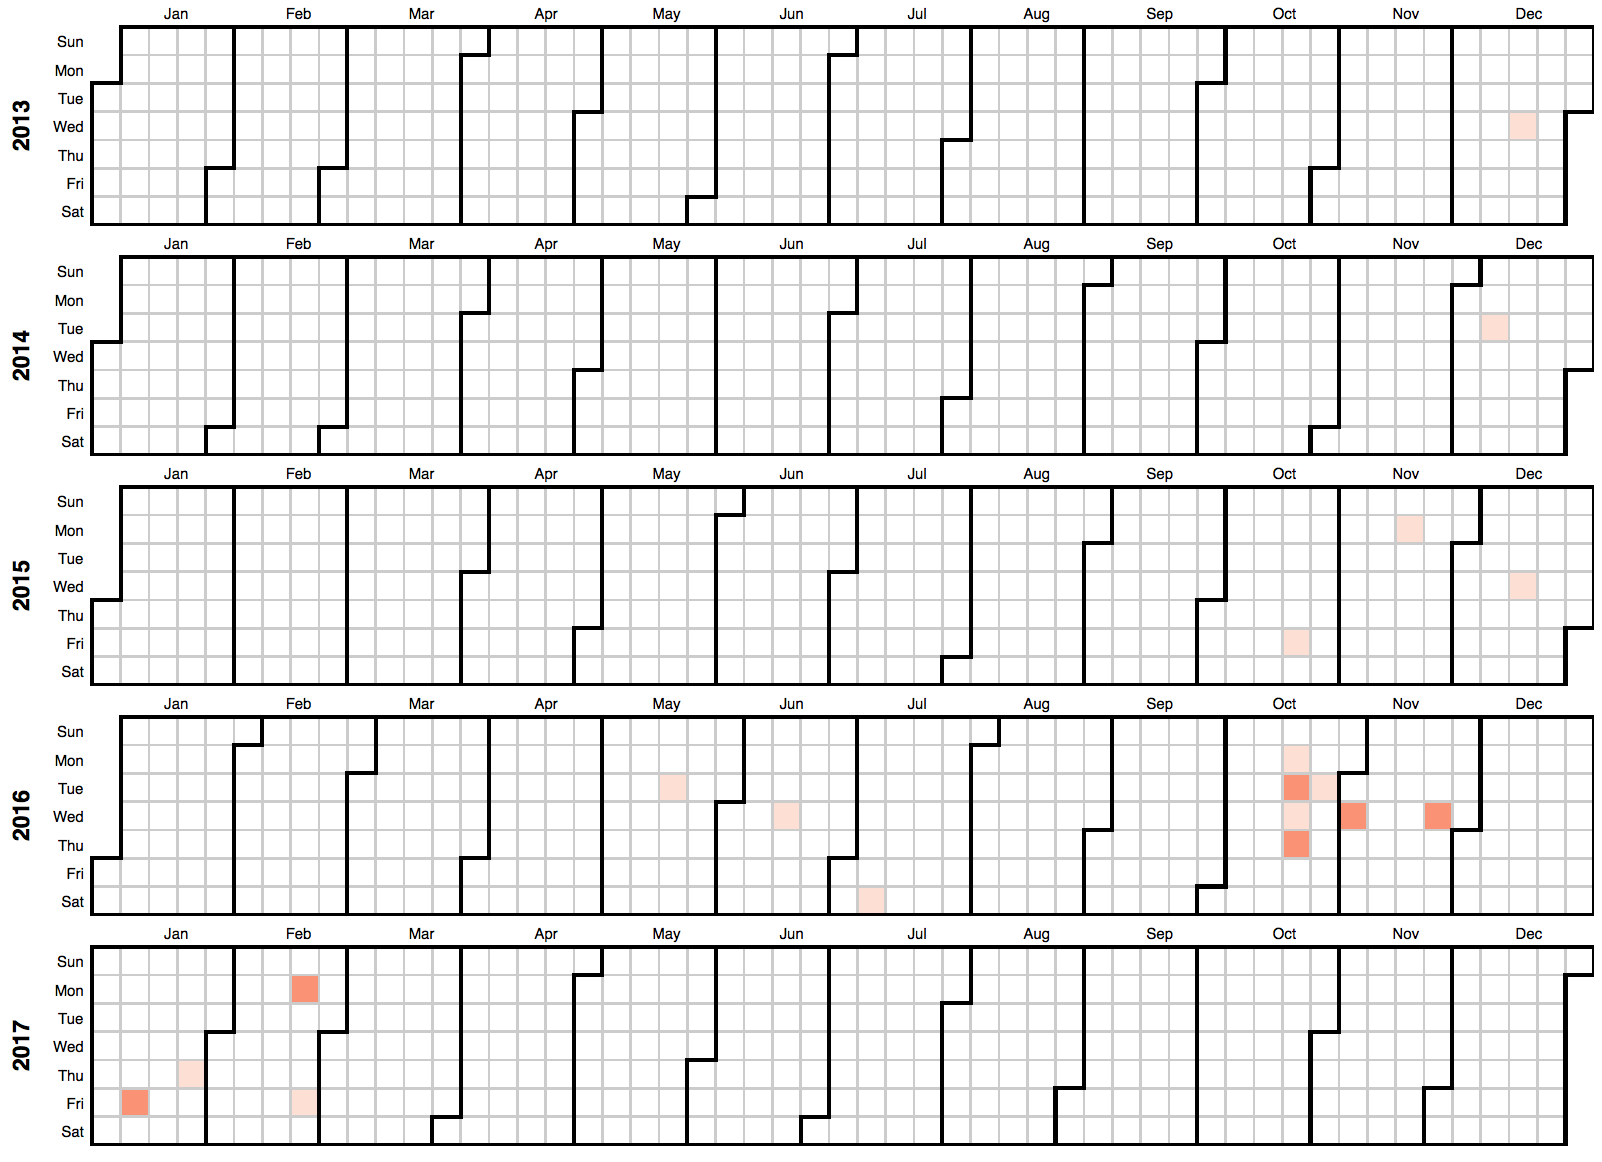
Note: The chunk of drinks in Oct 2016 were from free drinks at a conference.
More references
In producing the visualization, I went through the code line by line to try and understand what was being done. In the code at bl.ocks.org/csiu, I made comments on what each chunk does. Furthermore, a couple of references I thought were useful are:
Selection
- How Selection Works (Mike Bostock, 2013)
- In d3 what does the construct
.data([]).exit().remove()mean? (stackoverflow, 2015) - Three little circles (Mike Bostock, 2014) for an example of how selection & binding works
- Thinking with joins (Mike Bostock, 2012) to understand
.enter()and.exit()
Rollups
- D3.JS ROLLUPS (LINDSEY, 2014)
- D3 Nest Tutorial and examples (phoebebright, ?)