I want to continue from where I left off (ie. visualizing League of Legends: Base champion statistics).
The Jupyter Notebook for this little project is found here.
Scraping 134 more web pages for “Primary role”
Yesterday, I scraped only 1 page. Today, I will scrape 134 more to obtain the “Primary role” information of each League of Legends champion. This data is made available on Gist.
from bs4 import BeautifulSoup
import requests

primary_role = []
for url in dat.href:
    html_data = requests.get(url).text
    soup = BeautifulSoup(html_data, "html5lib")

    role = soup.find('div', attrs={'class' : 'champion_info'}).table.a.text
    primary_role.append(role)

dat["primary_role"] = primary_role

# Save data
dat.to_csv("lol_base_stats-roles.tsv", index=False, sep="\t")
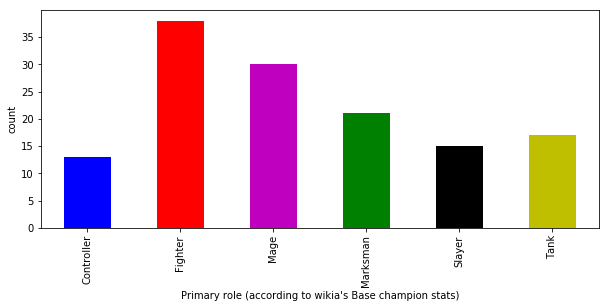
When we plot the distribution of primary roles, we find most champions are Fighters.
t-distributed Stochastic Neighbor Embedding (TSNE)
from sklearn.manifold import TSNE

model = TSNE(n_components=2, random_state=0)
X = model.fit_transform(data)
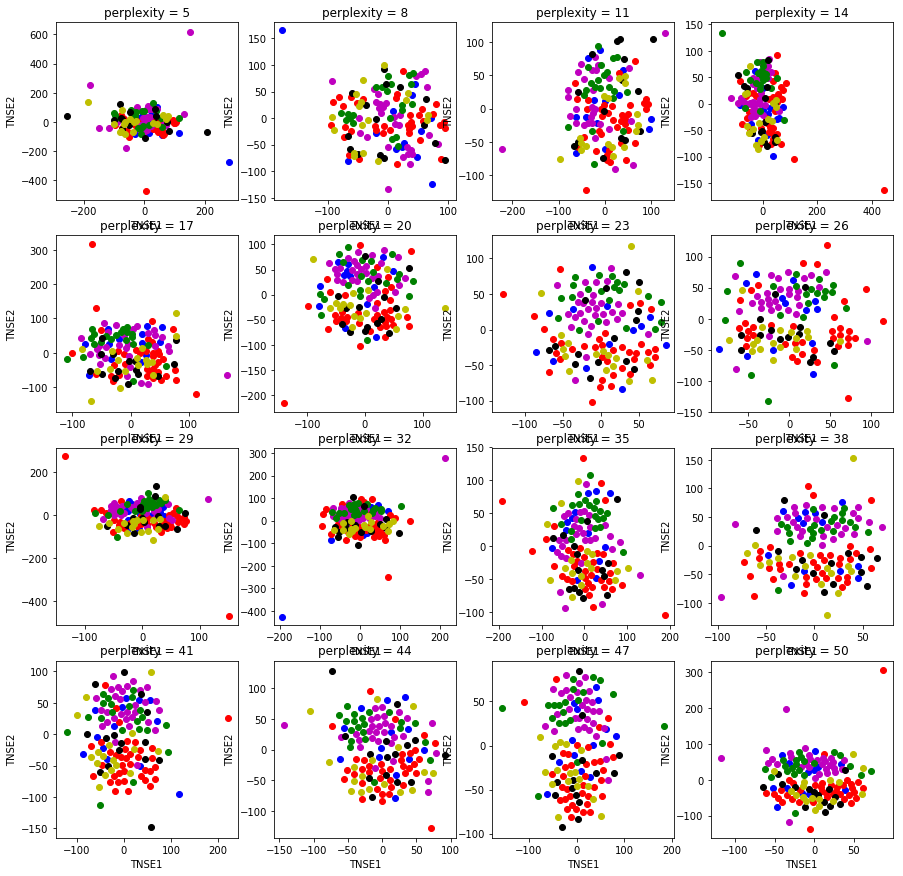
There are many dimensions to the data (eg. HP, HP+, HP5, HP5+, MP, …). We can therefore use t-SNE for visualization. More information about t-SNE is available at Laurens van der Maaten’s Github page. According to Scikit-learn:
t-SNE is a tool to visualize high-dimensional data. It converts similarities between data points to joint probabilities and tries to minimize the Kullback-Leibler divergence between the joint probabilities of the low-dimensional embedding and the high-dimensional data. t-SNE has a cost function that is not convex, i.e. with different initializations we can get different results.
When we plot the t-SNE plot at different perplexities, we get the following plots:
Principal component analysis (PCA)
from sklearn.decomposition import PCA

pca = PCA(n_components=2)
pca.fit(datc)
X = pca.transform(datc)
PCA, a dimensionality reduction algorithm, can also be used to explore variation in a data set.
Principal component analysis (PCA) is a technique used to emphasize variation and bring out strong patterns in a dataset. It’s often used to make data easy to explore and visualize (Victor Powell)
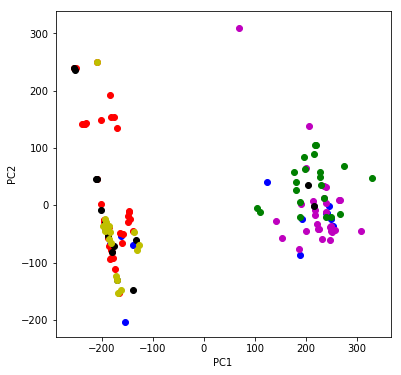
From this plot, we see that the Mage and Marksman champions are more similar to each other than to Fighters, Tanks, and Slayers. Consulting my brother, he said the Mage and Marksman champions do tend to fight at a range.