Today I went to the BIG Research Day at UBC. There was a lot of great speakers, many posters, and cool research. I ended up having dinner with one of the speakers who lead a hackathon I participated in. Got home late and so today’s project will be simple. In inspiration of the (VanBUG) talk, today I’ll work on k-means clustering.
The Jupyter Notebook for this little project is found here.
Dataset
The dataset I’ll be using is the “Human Resources Analytics: Why are our best and most experienced employees leaving prematurely?” available at Kaggle.
Clustering
There are different ways to group the data, today I’ll focus on k-means clustering. In k-means clustering, the goal is to partition the data into k clusters by assigning the data point to the nearest cluster mean.
from sklearn.cluster import KMeans

km = KMeans(n_clusters=3, random_state=1)
y_pred = km.fit_predict(data)

# We can then use y_pred to color the plots
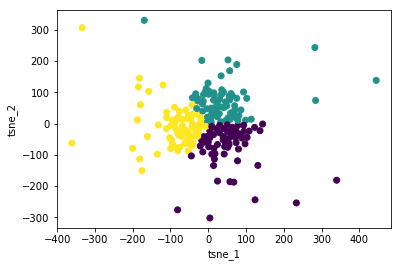
I generate the figure as follows:
- Load the dataset, keeping only numerical features
- Reduce the dataset into 2 dimensions using TSNE for ease of visualization
- Do k-means clustering
- Plot the TSNE data and colour the data points by the k-means predicted clusters