In the past few posts, I have installed a PostgreSQL database, imported data, and extracted data. I am now at a state where I can explore the data and ask a couple of data analyst related questions.
The Jupyter Notebook for this little project is found here.
Exploratory analysis: What is in my data?
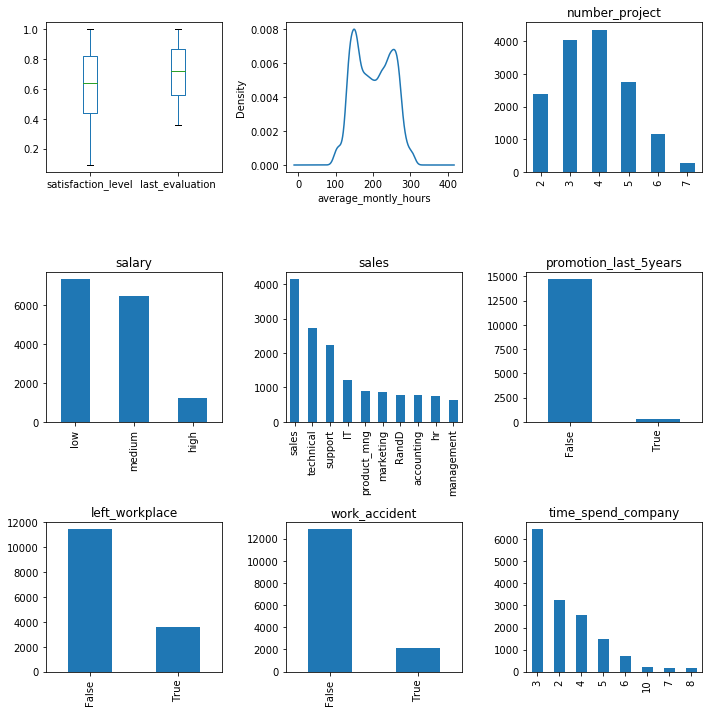
The plots were generated as follows:
# Define layout of subplots
plt.rcParams["figure.figsize"] = [10,10]
fig, ax = plt.subplots(nrows=3, ncols=3)

# First plot
the_frame.iloc[:,1:3].plot.box(ax=ax[0,0])

# Second plot
the_frame["average_montly_hours"].plot.kde(ax=ax[0,1])
ax[0,1].set(xlabel = "average_montly_hours")

# Bar plots in 2nd and 3rd rows
features = ['number_project', 'time_spend_company', 'work_accident', 'left_workplace', 'promotion_last_5years', 'sales', 'salary']

for i in range(1,3):
    for j in range(3):
        feature = features.pop()

        the_frame[feature].value_counts(sort=True).plot(kind='bar', ax=ax[i,j])
        ax[i,j].set(title = feature)

# Bar plot in end of first row
feature = features.pop()
the_frame[feature].value_counts(sort=False).plot(kind='bar', ax=ax[0,2])
ax[0,2].set(title = feature)

# Fix spacing
plt.tight_layout()
Answering simple questions:
1) Do people who work more hours per month tend to have higher salaries?
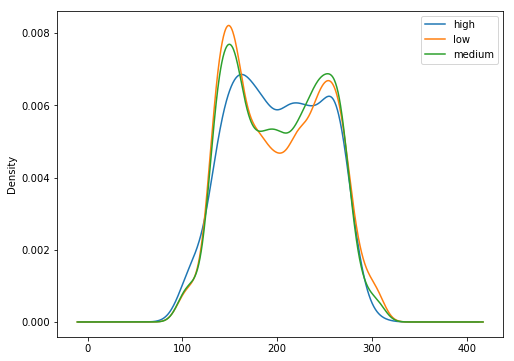
No. The distribution of average monthly hours are about the same for each pay grade.
2) Are people with high salary more happy (higher satisfaction level)?
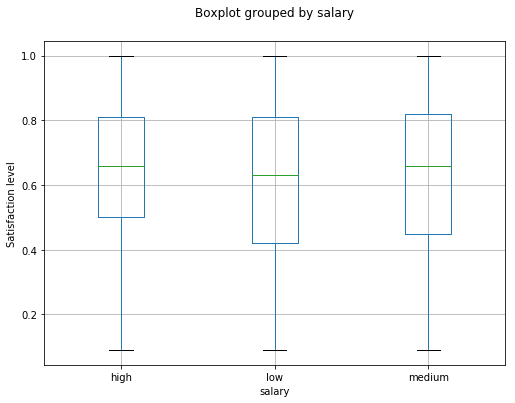
Somewhat. People with higher salaries seems to be marginally more satisified.
3) What department has more work accidents?
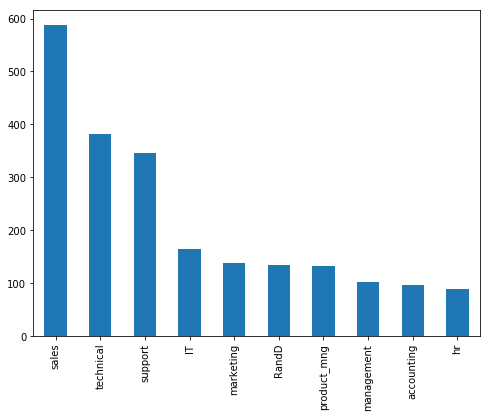
Those in the sales department have the highest number of work accidents.