Today, I want to try something new (and to take a look at pesticide data). The data I use comes from Kaggle’s Pesticide Data Program (2015) data set uploaded by the United States Department of Agriculture.
My workflow is in R and the markdown document for this little project is found here. (You can also find the R Markdown document in the sample directory, but it’s less pretty.)
Data from an SQLite database
The Kaggle data was stored in an SQLite database and the DBI library was used to connect to and extract data from this database.
library(DBI)

con <- dbConnect(RSQLite::SQLite(), dbname="data/database.sqlite")
results <- dbGetQuery(con, 'SELECT * FROM resultsdata15')
dbDisconnect(con)
Dealing with missing data
There are 2,333,911 rows and 16 columns in the results data frame; however, not all columns are complete. Some columns contain missing data:
# How many NAs per column?
(na_in_column <-
  colSums(is.na(results))) %>%
  sort(decreasing = TRUE) %>%
  as.data.frame()
##              num_na
## confmethod2 2333911
## quantitate  2331898
## annotate    2329076
## concen      2295160
## confmethod  2295160
## sample_pk         0
## commod            0
## commtype          0
## lab               0
## pestcode          0
## testclass         0
## lod               0
## conunit           0
## mean              0
## extract           0
## determin          0
To deal with this, we remove the columns with NAs.
## Remove columns with NAs
results <- results[na_in_column==0]
We are left with 11 columns:
sample_pkcommod- COMMODITY TYPE in 2015 PDP Samplescommtype- COMMODITIES Sampled/Analyzed by PDP in 2015 (Fresh Product Unless Otherwise Noted)lab- PDP Participating LABORATORIES in 2015pestcode- Compounds (PESTICIDES) Analyzed by PDPtestclass- TEST (COMPOUND) CLASS in 2015 PDP Analytical Resultslod- Limit of Detectionconunit- Concentration/LOD Unit-of-Measure Codemean- MEAN RESULT in 2014 PDP Analytical Results (O, A, and R indicated Positive Detections)extract- EXTRACTION METHOD in 2015 PDP Analytical Resultsdetermin- DETERMINATIVE METHOD in 2015 PDP Analytical Results
Start with a simple question
Before I doing some heavy analysis, I want to know:
Which commodity type has the highest detected level of pesticides?
A simple boxplot will do:
# Get my data
select(code$commod, code, label) %>%
  right_join(results, by = c("code"="commod")) %>%
  mutate(label = ifelse(is.na(label), code, label)) %>%
  plyr::rename(c("label" = "commod")) %>%

  # Plot
  ggplot(aes(x = reorder(commod, lod, FUN=median),
             y = lod, fill = commtype)) +
  geom_boxplot() +
  xlab("Commodities") +
  ylab("Limit of Detection in Parts-per-Million") +
  theme(
    axis.text.x = element_text(angle = 90, hjust = 1, vjust = 0.5)
  )
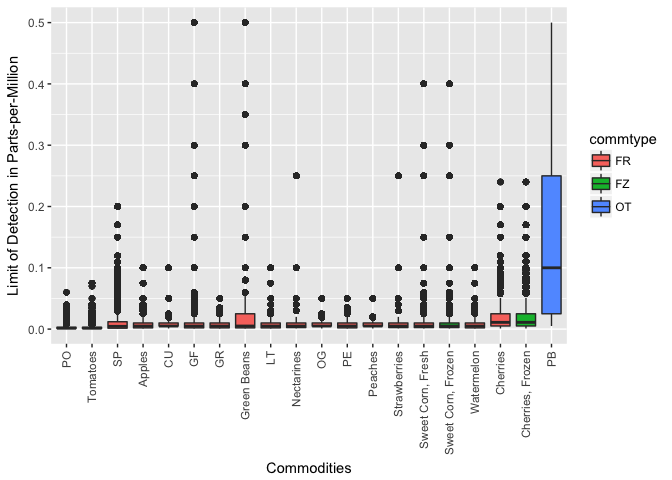
In the figure, the commodities (along x-axis) are sorted by median limit of pesticide detection. Commodity codes are replaced with the commodity labels if they are available. Boxplots are coloured by the commodity type, where “FR” is fresh, “FZ” is frozen, and “OT” is other.
We find “PB” has the highest level of pesticide limit of detection and that cherries are also (surprisingly) at the top of the list.