Day38: Refinement
Today we will continue with the exploration of the pesticides. The data I use comes from Kaggle’s Pesticide Data Program (2015) data set uploaded by the United States Department of Agriculture.
I continued with R and the markdown document for this little project is found here. (You can also find the R Markdown document in the sample directory, but it’s less pretty.)
Factor levels
One heuristics that I generally look at is the number of distinct values a variable take. A low number suggests the variable is grossly divided, possibly a categorical variable, and a high number suggests there are many divisions or the variable is a continuous variable.
sapply(colnames(results), function(var){
  results[[var]] %>% unique() %>% length()
}) %>%
  {data.frame(var = names(.), n = .)} %>%
  arrange(desc(n))
##            var     n
## 1    sample_pk 10187
## 2       concen  2582
## 3     pestcode   489
## 4          lod   126
## 5       commod    20
## 6    testclass    20
## 7          lab     8
## 8     annotate     5
## 9     determin     5
## 10  confmethod     4
## 11        mean     4
## 12    commtype     3
## 13  quantitate     3
## 14     extract     2
## 15     conunit     1
## 16 confmethod2     1
We find n = 1 for “conunit” and “confmethod2”, which tells you nothing interesting about the data. Such variables can be discarded from further analysis. From the results, I also see that the extraction method (“extract”) takes on 2 values.
Exploring the extraction methods
- 805 = MDA Modified QuEChERS Method
- 818 = NSL Animal Tissue Extraction Method
# Generate separate figures
p1 <-
  results %>%
  ggplot(aes(x=extract, fill=factor(extract))) +
  geom_bar(color="black") +
  xlab("") +
  theme(legend.position = "None")
p2 <-
  results %>%
  ggplot(aes(x=extract, y=lod, fill=factor(extract))) +
  geom_boxplot() +
  xlab("") +
  theme(legend.position = "None")
p3 <-
  results %>%
  ggplot(aes(x=commod, y=lod, fill=factor(extract))) +
  geom_boxplot() +
  labs(fill="Extraction\nmethod") +
  xlab("Commodity")

# Combine figures with library(cowplot)
cowplot::ggdraw() +
  cowplot::draw_plot(p1, 0, .5, .5, .5) +
  cowplot::draw_plot(p2, .5, .5, .5, .5) +
  cowplot::draw_plot(p3, 0, 0, 1, .5) +
  cowplot::draw_plot_label(c("A", "B", "C"), c(0, 0.5, 0), c(1, 1, 0.5), size = 15)
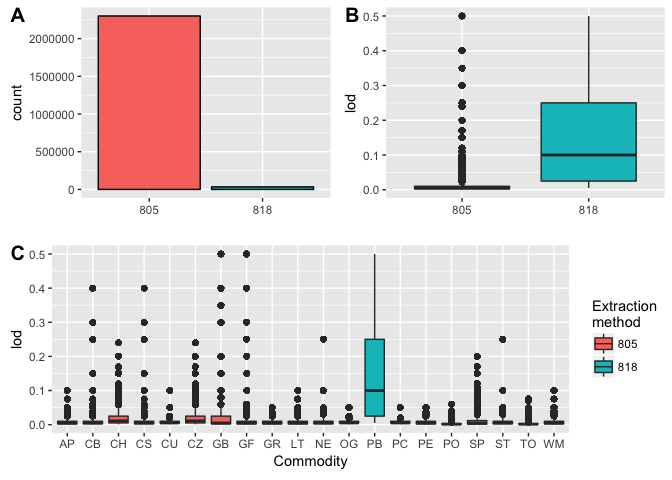
From the figure, the following insights could be drawn:
- [A] More samples are extracted by MDA Modified QuEChERS Method (805) than NSL Animal Tissue Extraction Method (818)
- [B] The limit of detection by MDA Modified QuEChERS Method (805) is lower, implying greater resolutions
- [C] “PB” is the only commodity extracted by NSL Animal Tissue Extraction Method (818)
Following the trail
PB had an unusually high Limit of Detection (LOD), I want to look into this further. When we compare the number of distinct levels per variable, we find only 1 lab does the NSL Animal Tissue Extraction Method (818).
##   sample_pk      commod    commtype         lab    pestcode   testclass
##         315           1           1           1         107          10
##      concen         lod     conunit  confmethod confmethod2    annotate
##           4          13           1           2           1           1
##  quantitate        mean     extract    determin
##           1           3           1           3
We next took a look at the LOD by Pesticide for each pesticide class type:
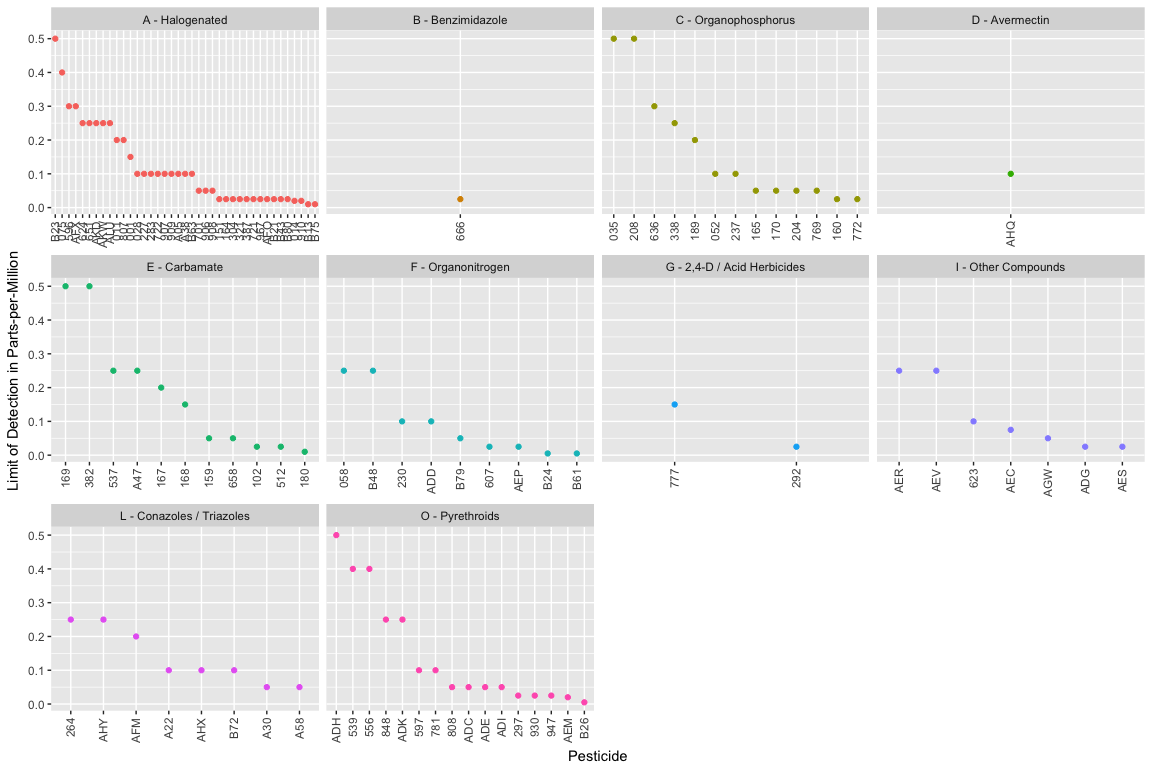
From this figure, we see (1) there are relatively a lot of Halogenated compounds and only a handful Benzimidazole, Avermectin, and 2,4-D / Acid Herbicides compounds; and (2) the pestcode, testclass, and LOD information are all linked.
(Initially I made a boxplot, but no boxes were drawn implying no variability.)
Reaching the right information
Since understanding the data more, I come to realize using only the complete cases is not the ideal way to go; instead, the columns with missing information (containing the pesticides concentrations) must be kept.
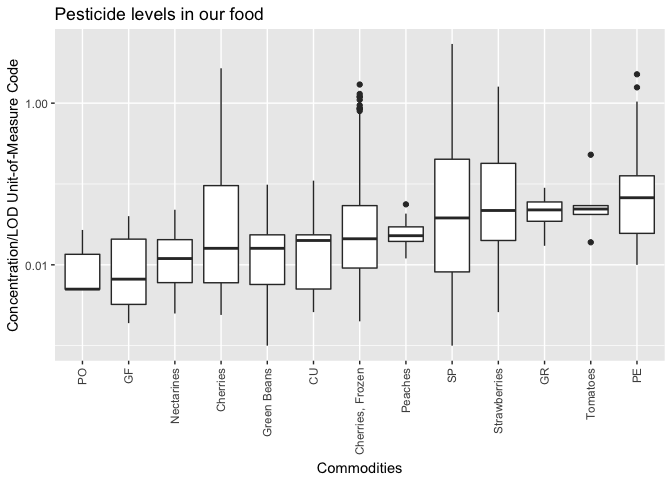
concen- Concentration/LOD Unit-of-Measure Codequantitate- QUANTITATION METHOD in 2015 PDP Analytical Resultsannotate-ANNOTATED INFORMATION in 2015 PDP Analytical Resultsconfmethod- CONFIRMATION METHOD in 2015 PDP Analytical Resultsconfmethod2
And using the the correct variable (ie. “concen”), we refine/corrected the figure from yesterday.