Yesterday I was having a difficult time with the Kaggle kernel. Today, I explored the Sberbank dataset locally using my normal setup.
The R Markdown document of this little project can be found here (and the Markdown version is here).
Data size
The training data has 30,471 samples and 292 columns. The 292 columns refer to 1 ID column, 290 feature columns, and 1 price_doc output column that the competition is trying to predict.
How complete is the data?
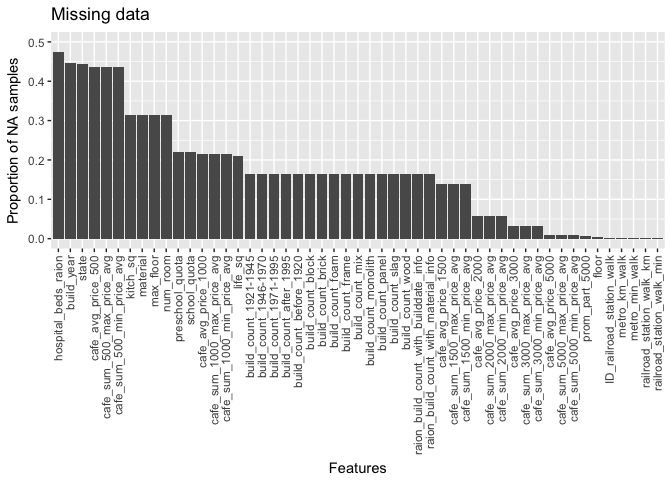
When working with data, ideally it would be complete and not missing any values. In the dataset, 17% of columns contain missing data in at least 1 sample. Here we show the proportion of missing data per feature with missing data.
What columns are there?
290 is a lot of features, I next wonder what they are by grouping them by the feature label. I come up with the following categories of features:
- Features involving whether the individual is male or female
- Features involving the distance to places of interest such as schools or churches
- Features involving average prices
- Features that contain “raion” in label (I don’t know what that is)
- Features that are count data
- Features that contain “part” in label
- Features that contain “1line” in label
- Features that contain “sqm” in label
- and the remaining features which I label as “Other”
Some of the Other features: floor space
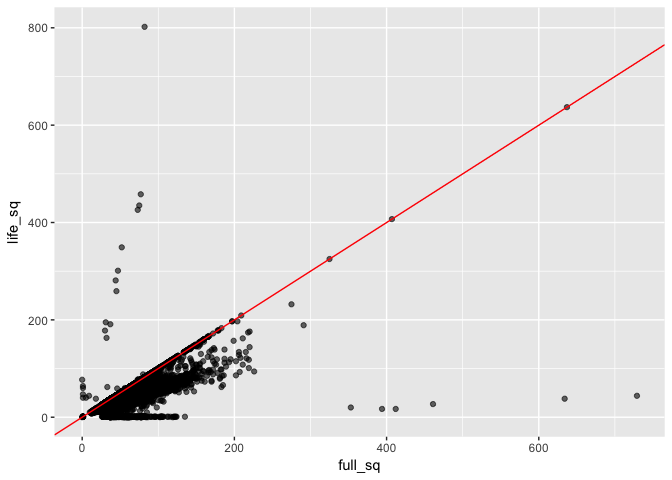
I also wanted to take a closer look at full_sq and life_sq. In particular, I wanted to know what was the difference between the two.
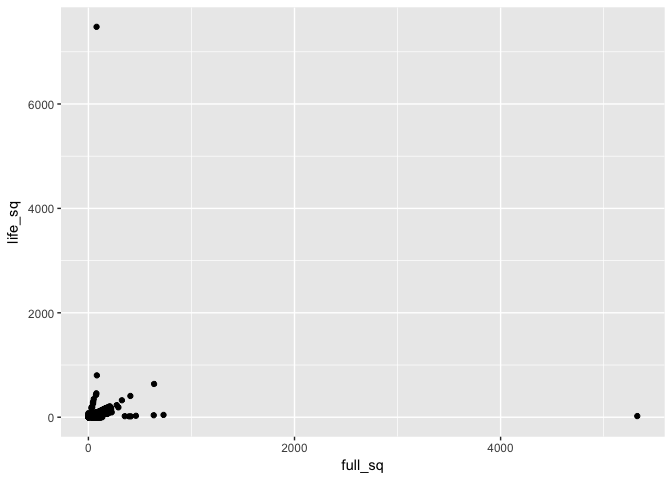
From this plot, it seems like there are 2 outlier samples.
##      id full_sq life_sq price_doc  diff
##   <int>   <int>   <int>     <int> <int>
## 1  3530    5326      22   6868818  5304
## 2 13549      79    7478   7705000 -7399
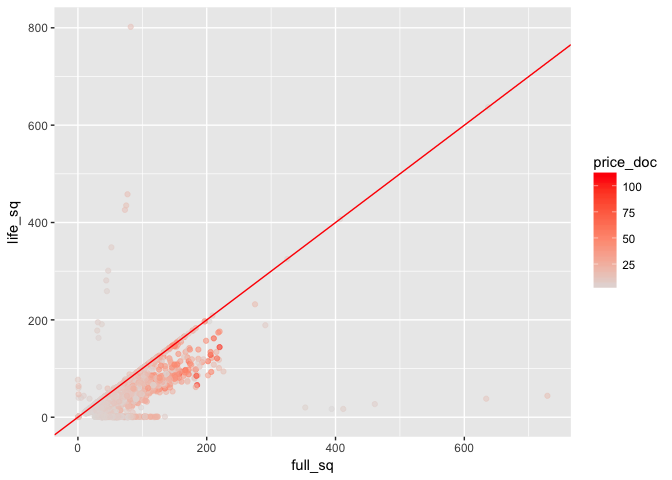
When we consider the price of the property, it does not look like these 2 samples (with the greater floor space) are higher in price (which is counter intuitive because I would expect bigger properties cost more).
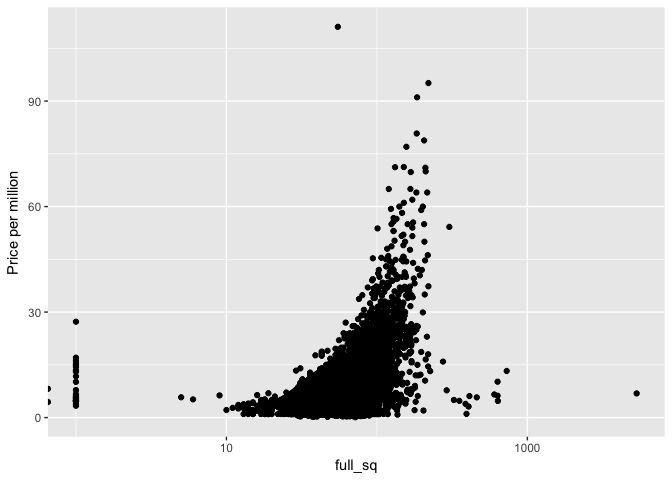
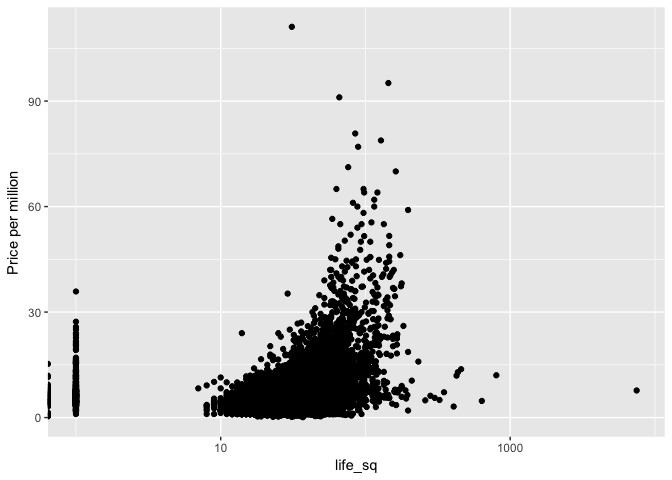
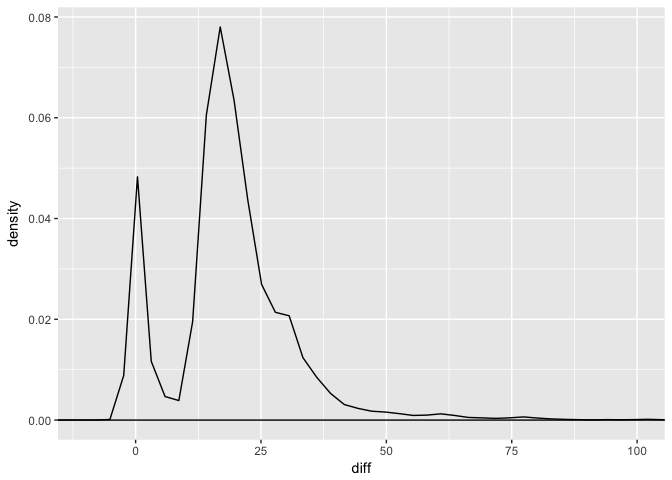
Removing these outlier samples, we find that full_sq tends to be larger than life_sq by ~22 sq. When we consider the property price (per million), a number of properties around 200 full_sq are priced higher.
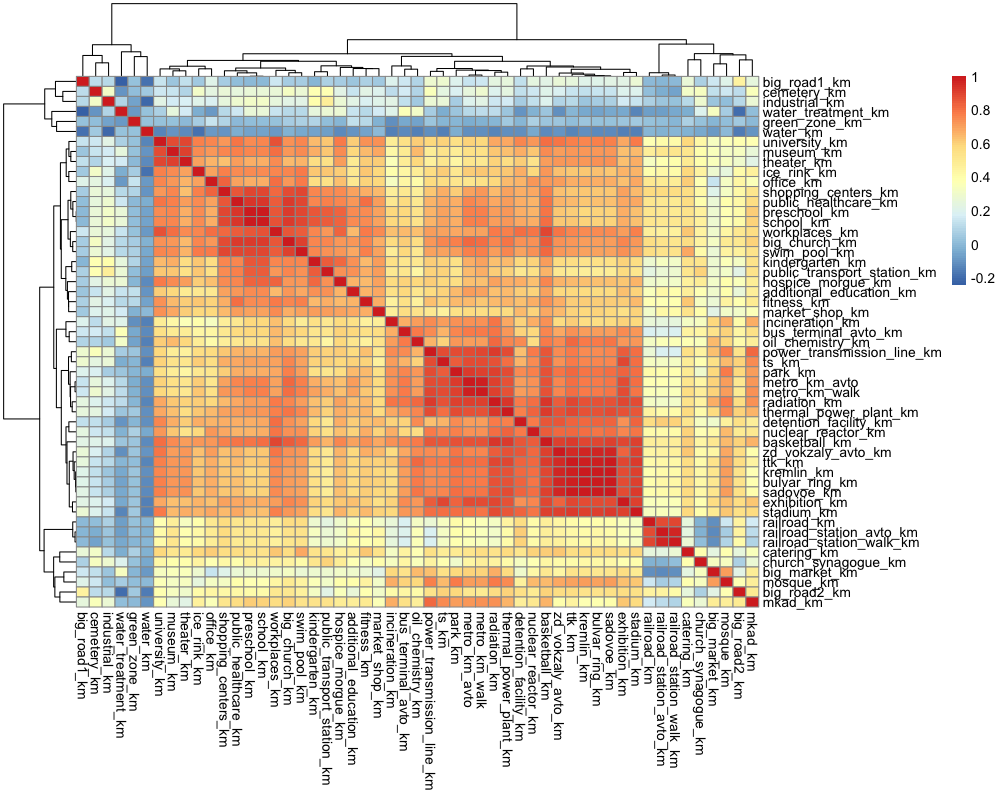
Distance features
Another group of features I want to look at is distance to places of interest. Running a correlation on these features, we find that water, green, industrial, cemetery, and big roads seem to be far from everything else.
There are many ways to explore the data, and today I showcase a couple – csiu