Yesterday I started working on visualizing emoji data, but I ran into problems displaying unicode (ie. emojis) on ggplots. When I shared this on twitter, Maëlle Salmon kindly suggested to use emojifont.
@celiassiu solution 1 for emojis in ggplot2 = https://t.co/GraxYJ2EeH see e.g. https://t.co/whBvDMOZSK
— Maëlle Salmon (@ma_salmon) May 9, 2017
However, when I ran the default base plot/ggplot2 code, no emojis were displayed in the RStudio plot viewer.

Alternative solutions
In the process of solving my problem, I tried the following:
emojifont– no emojis were displayedemoGG– get an error when I try to set emojis as an aesthetics- Make a dictionary between the emojis and the unicode from Tim Whitlock’s Emoji Unicode Tables and do something with that
Displaying unicode in ggplot
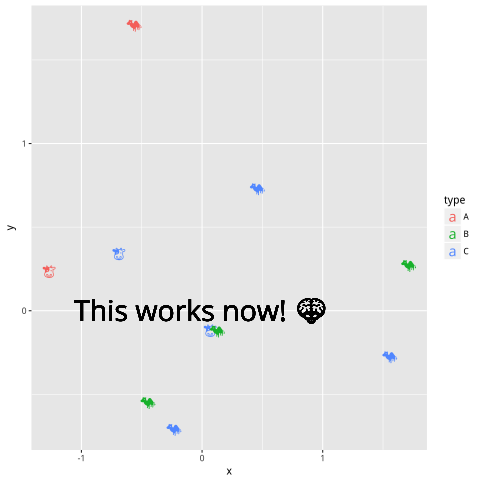
Eventually I retried emojifont, but this time saving the plot into a file and it works!
library(emojifont)
library(ggplot2)

## You need to download this file
load.emojifont('OpenSansEmoji.ttf')

## Setup data
set.seed(123)
x <- rnorm(10)
set.seed(321)
y <- rnorm(10)

d <- data.frame(
  x=x,
  y=y,
  label = sample(c(emoji('cow'), emoji('camel')), 10, replace=TRUE),
  type = sample(LETTERS[1:3], 10, replace=TRUE))

png("my_plot.png")
  ggplot(d, aes(x, y, color=type, label=label)) +
    geom_text(family="OpenSansEmoji", size=5) +
    geom_text(x=0, y=0, label="This works now! \U0001f47e",
              family="OpenSansEmoji", size=10,
              color = "black")
dev.off()
I wish I knew this before hitting dead ends during the search of alternative solutions.