In the spirit of drawing insight from data and data storytelling, I thought I would do something new today.
Today I explore urban data. Specifically, the Open Data Catalogue: Animal Control Inventory of Vancouver City.
Dataset:
A record of animals that have come into the custody of the Vancouver Animal Control Office.
The R Markdown for this little project is found here.
Downloading the data
file_source <- "ftp://webftp.vancouver.ca/OpenData/csv/"
filenames <- c("DeadAnimals.csv", "LostAnimals.csv", "RegisteredAnimals.csv")

# Save CSV files to the data/ directory
for (f in filenames) {
 download.file(url = paste0(file_source, f), destfile = paste0("data/", f))
}
One of the files is named “DeadAnimals.csv”.
Sounds interesting.
Dead pets
According to the catalogue, “DeadAnimals.csv” provides information on domestic deceased pets picked up by City staff.
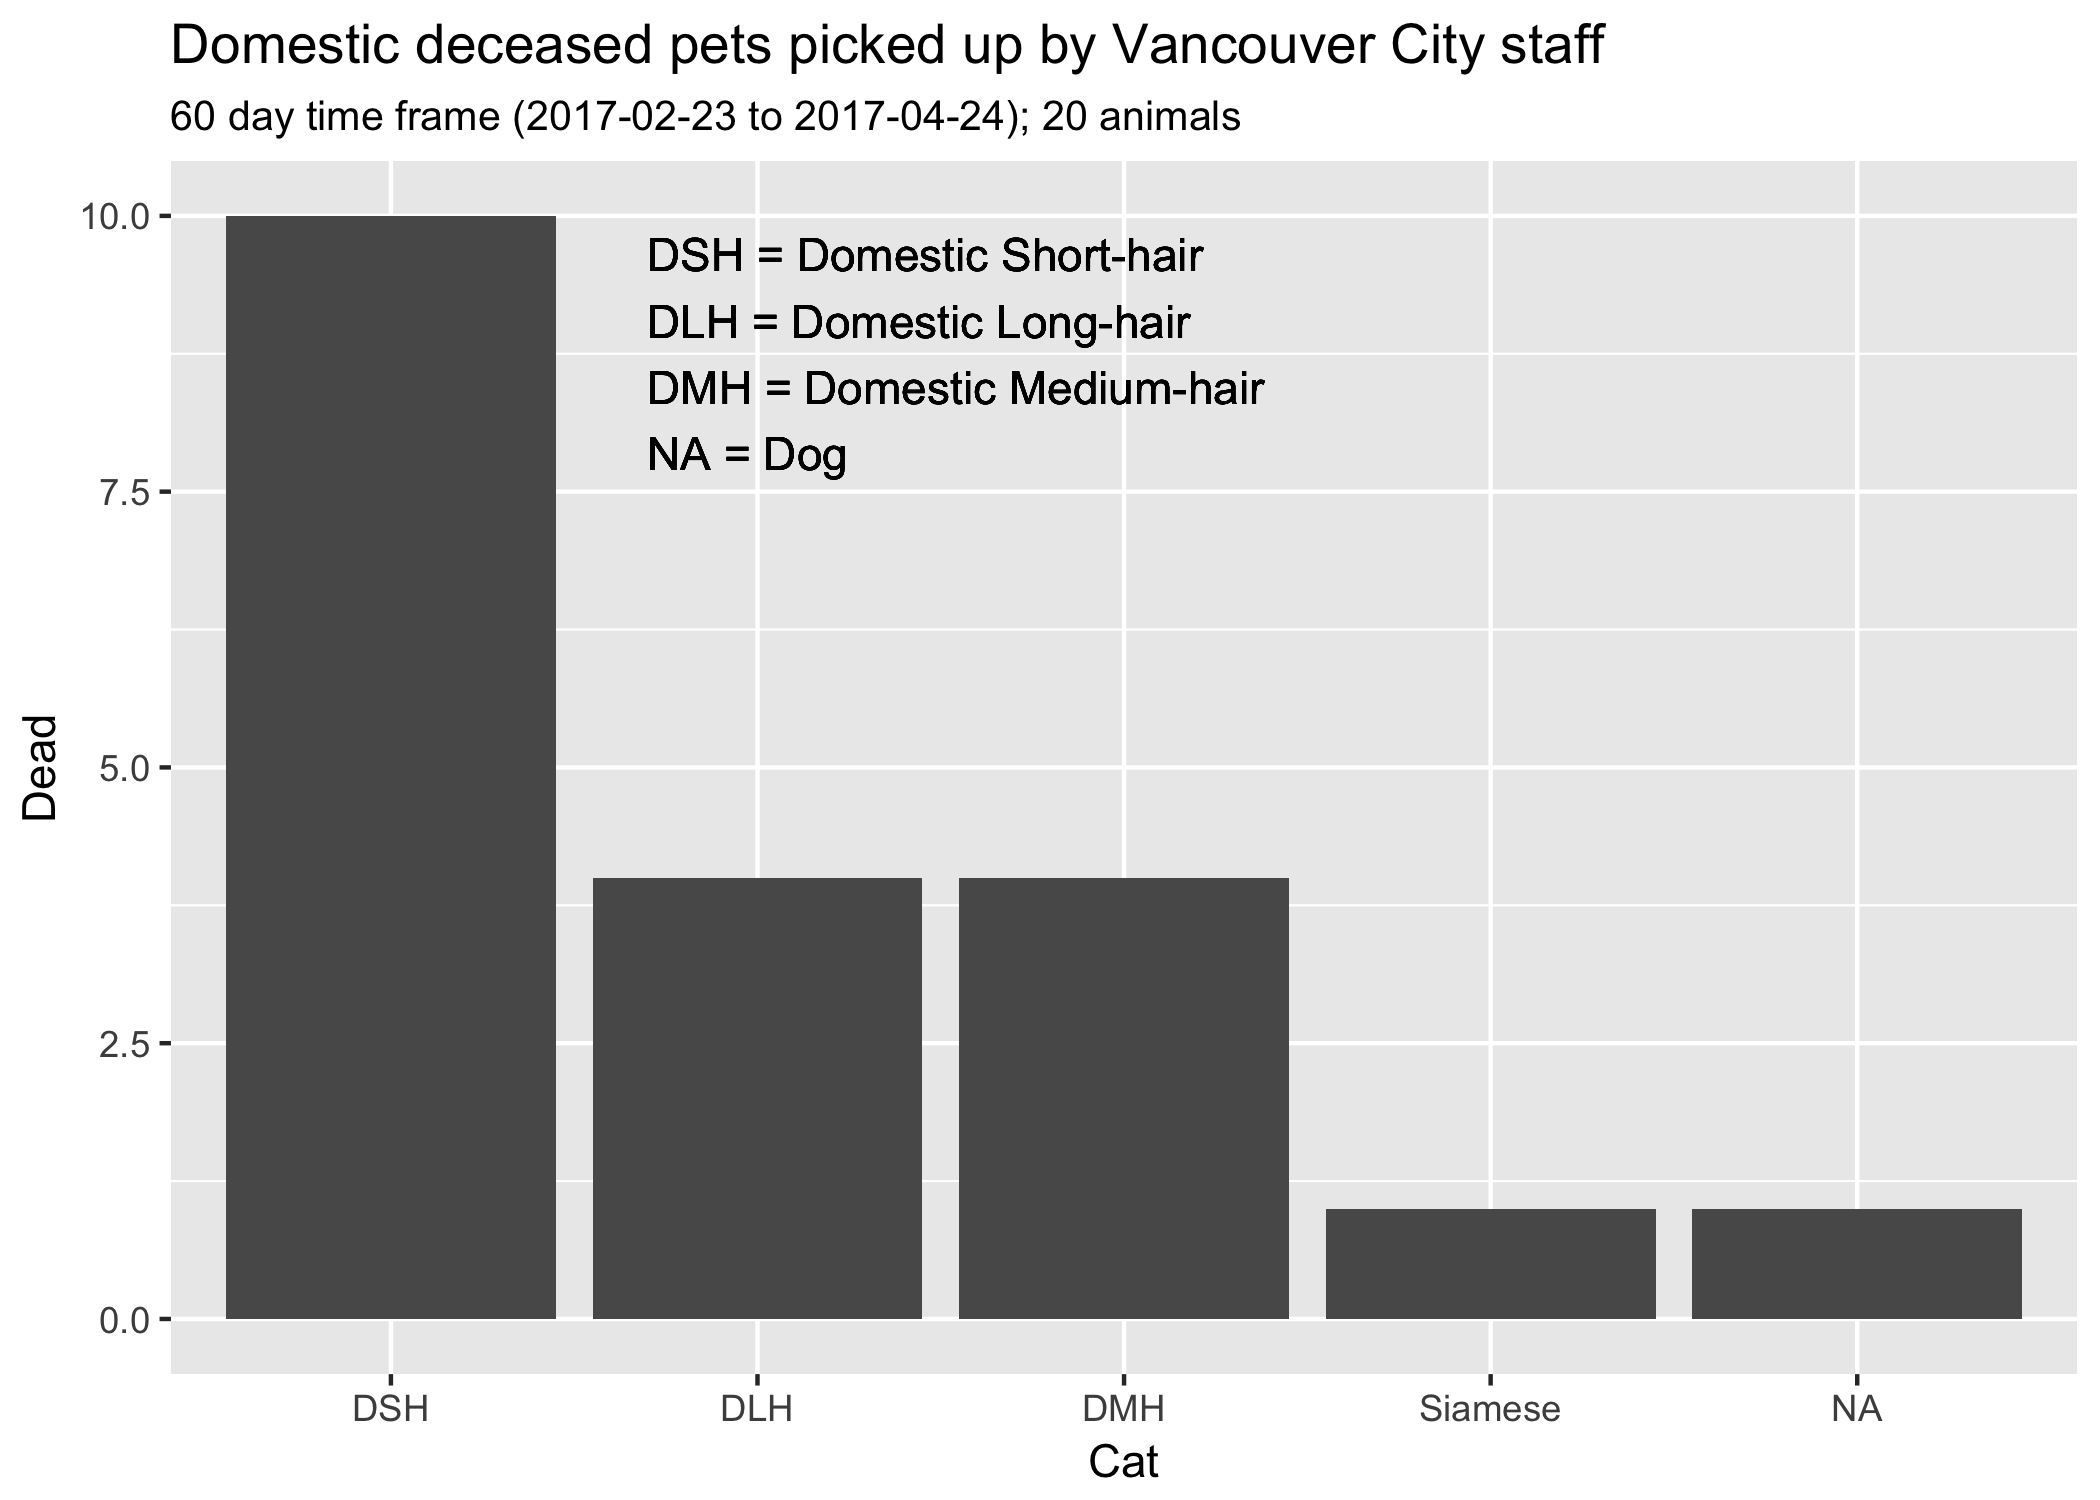
Here we find that between the 60 days of the dataset, the majority (19/20) of deceased pets picked up by City staff are cats (and there is 1 dog).
Lost animals
Another data set included in this catalogue is “LostAnimals.csv”, which provides information on animals that are reported lost.
I want to know how many animals are lost per year.
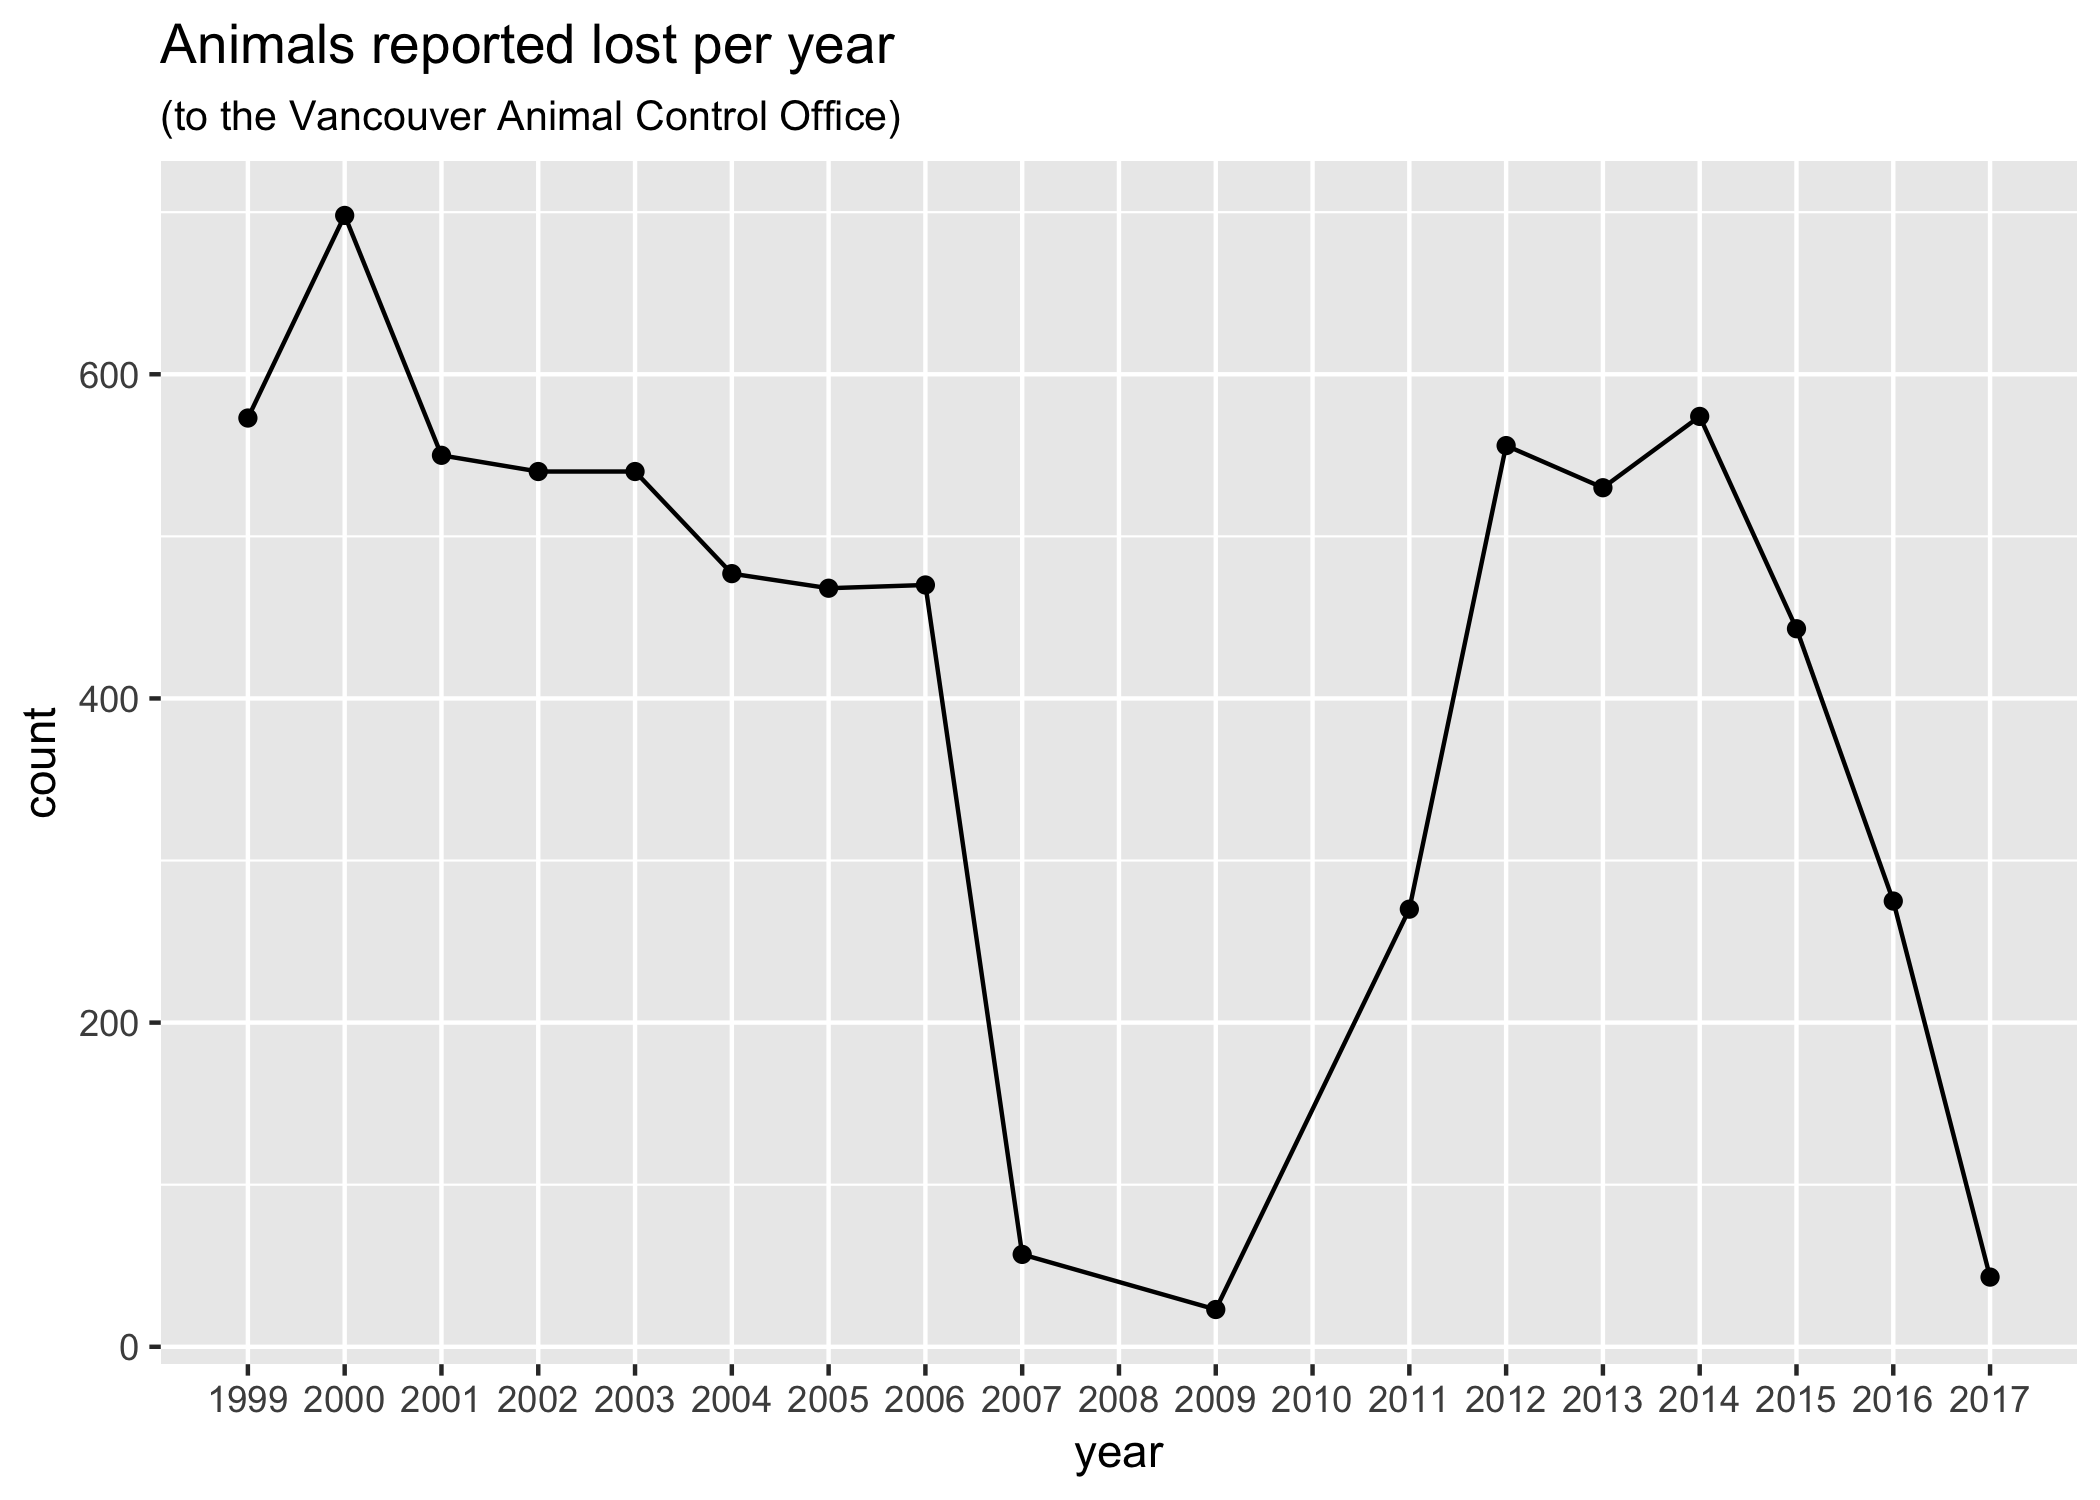
Here we see that the data for 2017 is not yet complete (we are only at May 2017) and that there is an interesting dip around 2008 and that no reports of lost pets was made in 2008. One possible explanation is that 2008 was the recession and government spending was directed to something other than documenting lost pets.