In urban data, there is often location information – which makes me think of maps. And so, for today’s project, I use Python to learn how to draw maps.
The Jupyter Notebook for this little project is found here.
Python’s Basemap module
Using the Basemap module, we are able to do stuff like draw the earth.
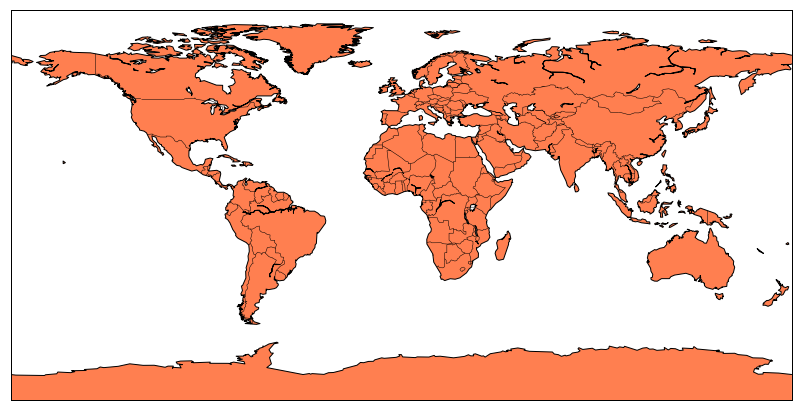
from mpl_toolkits.basemap import Basemap as Basemap

Map = Basemap()

Map.drawcoastlines()
Map.drawcountries()
Map.drawmapboundary()
Map.fillcontinents(color = 'coral')
Orthographic projection
We can also draw the earth as a sphere in an orthographic projection. The following example (centred on Vancouver, BC) is from Cameron Cooke’s “The Big Picture”.
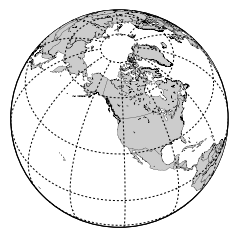
Map = Basemap(projection='ortho', lat_0=49, lon_0=-123, resolution='l')

# draw coastlines, country boundaries, fill continents.
Map.drawcoastlines(linewidth=0.25)
Map.drawcountries(linewidth=0.25)
Map.fillcontinents()

# draw the edge of the map projection region (the projection limb)
Map.drawmapboundary()

# draw lat/lon grid lines every 30 degrees.
Map.drawmeridians(np.arange(0,360,30))
Map.drawparallels(np.arange(-90,90,30))
Mercator projection
Finally, we show the traditional 2D mercator projection of Vancouver, BC. The longitude and latitude coordinates are as follows:
# Coordinates for Vancouver, BC
Van_lon = -123.1207
Van_lat = 49.2827
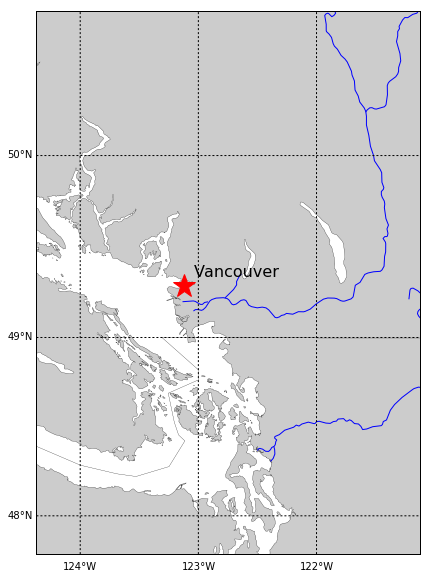
This figure is based on code found in Bill Mill’s “Simple maps in Python”.
Map = Basemap(
    projection='merc', resolution='h', area_thresh=0.1,
    lat_0=Van_lat, lon_0=Van_lon,
    llcrnrlat=Van_lat-1.5, llcrnrlon=Van_lon-1.25,
    urcrnrlat=Van_lat+1.5, urcrnrlon=Van_lon+2
)

# draw coastlines, country boundaries, fill continents.
Map.drawcoastlines(linewidth=0.25)
Map.drawcountries(linewidth=0.25)
Map.fillcontinents()

# draw the edge of the map projection region (the projection limb)
Map.drawmapboundary()

# draw rivers
Map.drawrivers(color='b', linewidth=1)

# draw lat/lon grid lines
Map.drawmeridians([int(Van_lon+i) for i in range(-1,3,)], labels=[1,0,0,1])
Map.drawparallels([int(Van_lat+i) for i in range(-1,3,)], labels=[1,0,0,1])

# label Vancouver
x,y = Map(Van_lon, Van_lat)
Map.plot(x, y, 'r*', markersize=24)
plt.annotate('Vancouver', xy=(x,y), xytext=(10,10), textcoords='offset points', fontsize=16)