Two days ago I asked Twitter how to draw maps in R, and Rod suggested to use Leaflet, an open-source JavaScript library for interactive maps in R. In this post, I use Leaflet to map City-Owned property data.
@celiassiu Maybe something like leaflet? https://t.co/XVDJ1LvPua
— Rod Docking (@rdocking) May 17, 2017
The R Markdown for this little project is found here.
Mapping City-Owned property data with Leaflet
City data was downloaded from the Vancouver Open Data Catalogue: City-Owned property data. Leaflet (code below) was used to create the following plot
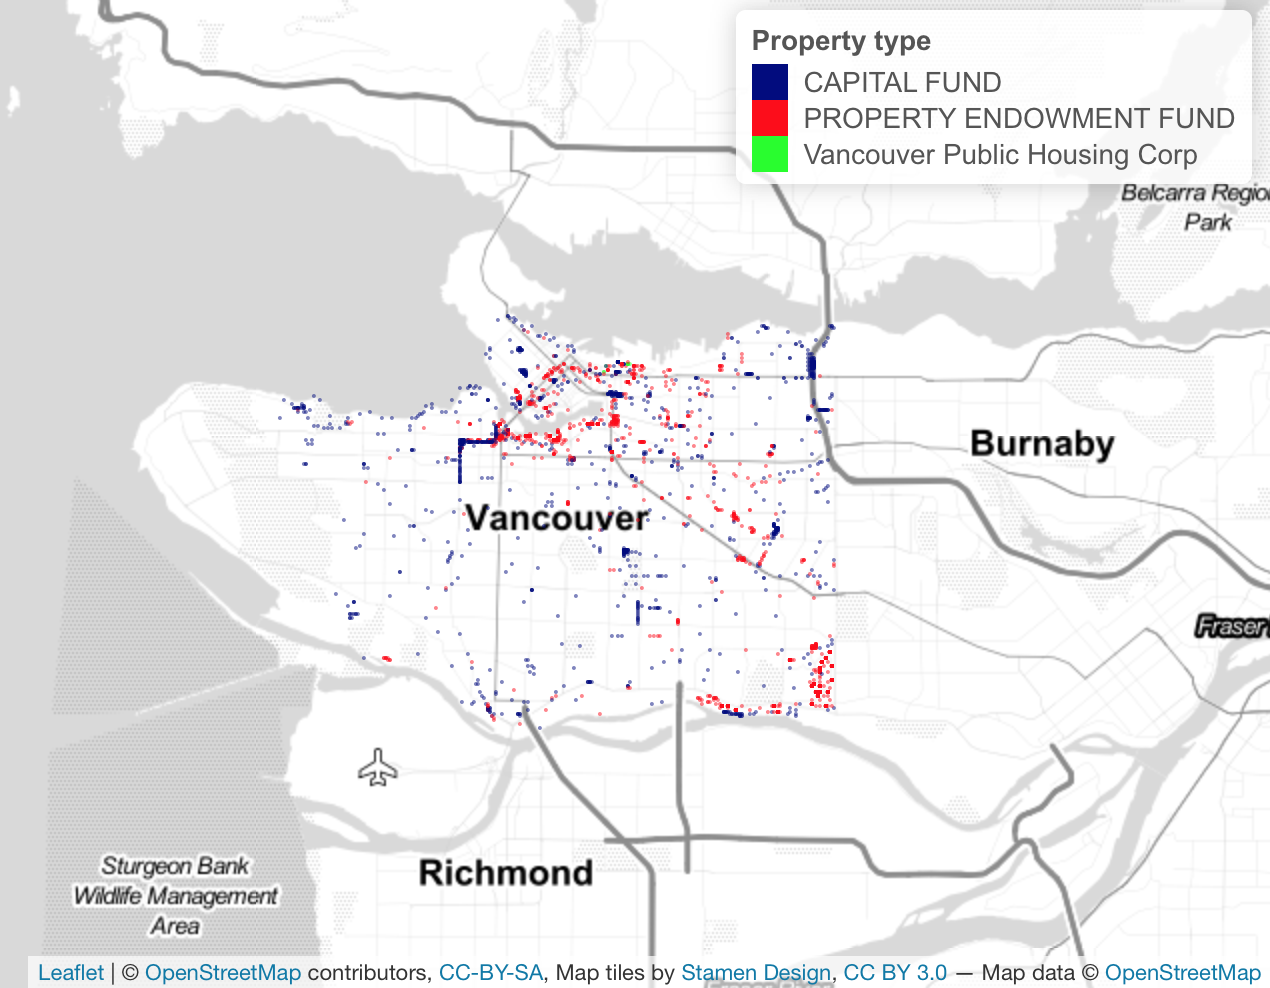
Here we can see (1) the city generally own properties around the south-eastern and region around False Creek, (2) the majority of city owned properties are capital funded or endowment funded properties, and (3) there are a number of capital funded properties along Arbutus street.
library(dplyr)
library(rgdal)
library(leaflet)

# Coordinates for Vancouver, BC
lng <- -123.1207
lat <- 49.2827

proj4string <-
  "+proj=utm +zone=10 +north +ellps=WGS84 +datum=WGS84 +units=m +no_defs "

# ------------------------------------------------------------------------------
# Load & wrangle data
shp <-
  readOGR("../data/city_owned_properties_shp/city_owned_properties.shp",
          layer = "city_owned_properties",
          GDAL1_integer64_policy = TRUE)

longlat <-
  # Select xy columns
  as.data.frame(shp) %>%
  select(coords.x1, coords.x2) %>%
  as.matrix() %>%

  # Convert between xy to long/lat
  proj4::project(proj4string, inverse=TRUE) %>%
  as.data.frame() %>%
  rename(long=V1, lat=V2) %>%
  tbl_df()

dat <- cbind(as.data.frame(shp), longlat)

# ------------------------------------------------------------------------------
# Define palette/color
city_properties <-
  c("CAPITAL FUND", "PROPERTY ENDOWMENT FUND", "Vancouver Public Housing Corp")
pal <- colorFactor(
  c("navy", "red", "green"),
  domain = city_properties)

# Draw map
leaflet(dat) %>%
  setView(lng=lng, lat=lat, zoom=11) %>%
  addTiles() %>%
  addProviderTiles(providers$Stamen.TonerLite) %>%
  addCircles(lng = ~long,
             lat = ~lat,
             weight = 1,
             color = ~pal(TYPE),
             stroke = FALSE,
             fillOpacity = 0.5) %>%
  addLegend("topright",
            pal=pal,
            values=city_properties,
            title = "Property type",
            opacity = 1)